Developer Productivity Engineering (DPE) is a practice for improving developer productivity leveraging technologies—rather than exclusively relying on traditional management best practices. This includes foremost analytic technologies for observing and collecting the many metrics and indicators of the overall health of your toolchain in terms of speed and reliability. Develocity captures, records, and presents these metrics. We wanted to learn which of these metrics are the most important, so we asked our users!
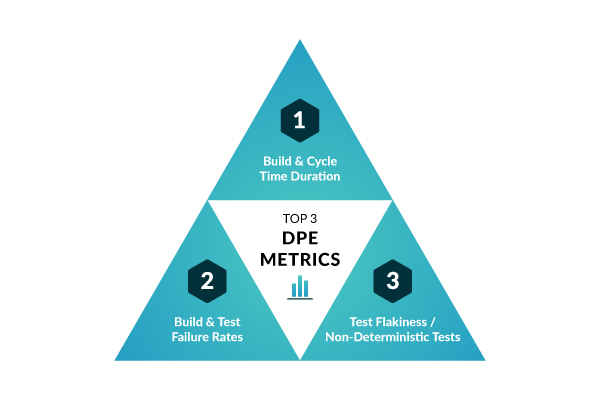 In this post, I present the top three metrics, in order of popularity, reported by our users when they were asked the question “What are the most important DPE metrics that Develocity provides?” By comparing notes with your peers, you can test your assumptions about what metrics are the most important and your rationale. Then you can consider whether or not you have the right tools in place to gather and report on these metrics. This will determine what actions you should take to improve developer productivity and your developer experience.
#1 – Build and Test Cycle Duration
By a slim margin, Build Duration was chosen as the most important metric provided by Develocity. It’s clear that understanding the time developers spend waiting on builds and tests to complete surfaces opportunities to greatly improve developer experience and thereby developer productivity. As one user commented:
“I would choose the build time, as it gives me a very good indication of all underlying problems. These include lots of failing tests, which are retried using the Retry Plugin, problems with downloading dependencies, and configuration issues with the cache.”
Develocity gathers build and test duration metrics via Build Scan®, and aggregates that data across multiple builds, projects, and users, and provides several visualization options.
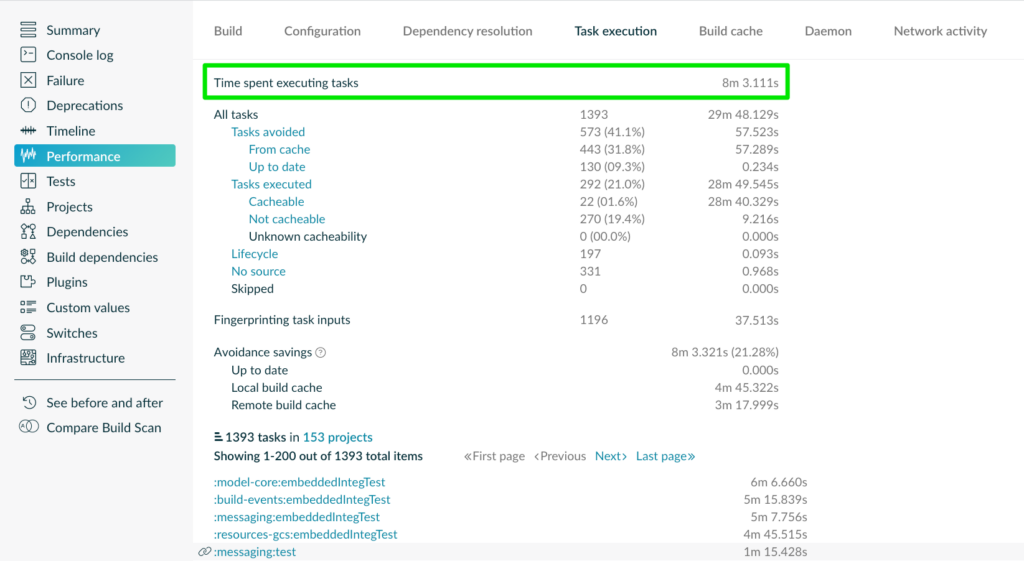
The “Performance” pane (image above) presents the average cycle time metrics over specific periods of time and provides a per-build interface, making it easy to drill down into specific builds. Several key metrics are included, which provide deeper insight into where the build is spending its time and where acceleration techniques such as build caching are contributing to better performance.
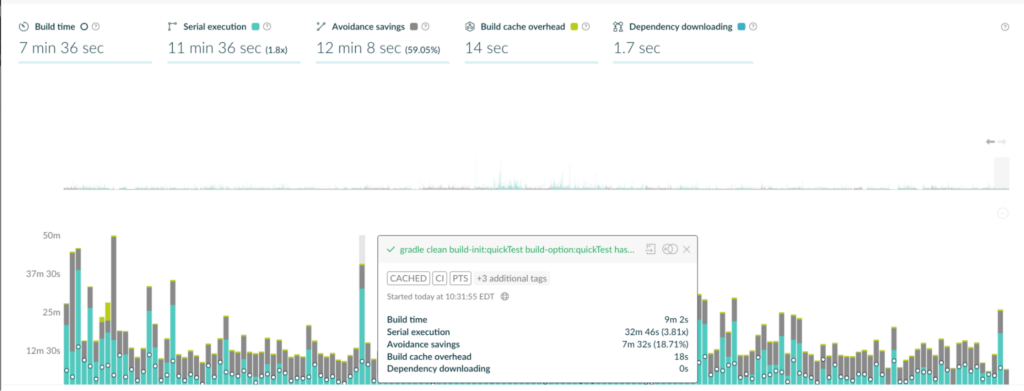
The data shown in the image above can be used to visualize trends and easily spot patterns in any of these key DPE performance metrics. Each of these data points is also available via a trend view with adjustable resolution.
| Build Time | The actual time spent waiting on build and test cycles to complete, as a mean average of all runs for a particular build |
| Serial Execution | The average cumulative execution time during a single build across parallel threads |
| Avoidance Savings | The average cumulative execution time saved by using acceleration features such as build caching and test distribution |
| Build Cache Overhead | The average of any additional time introduced by interacting with local or remote build caches |
| Dependency Downloading | The average time spent downloading dependencies during the build |
In the “Trends” pane, the metrics are plotted individually, with deeper statistical analysis available:
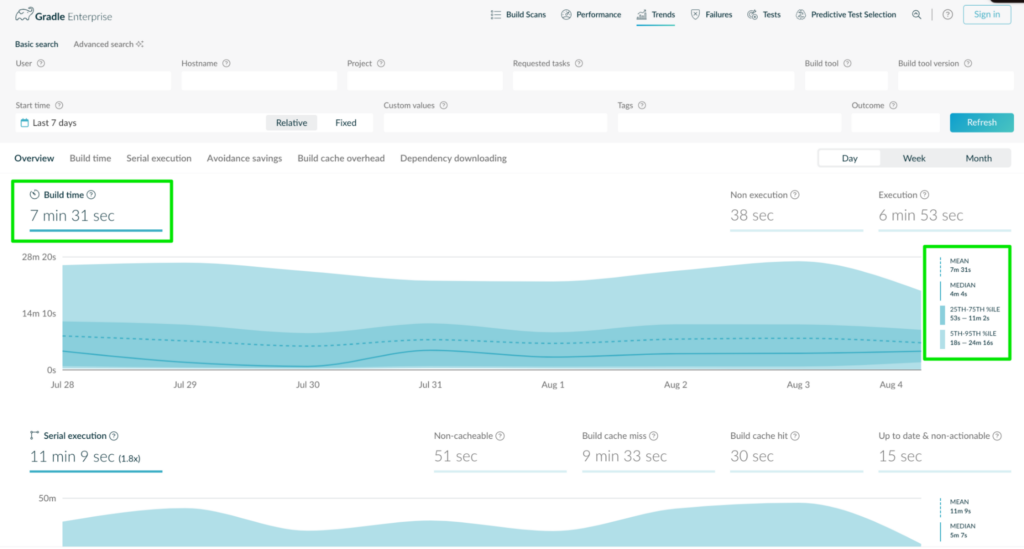
As one user put it simply, “For me, the most important feature is Trends because it shows if build health is going in the right direction.”
It’s an eons-old adage that “What gets measured gets improved.” Develocity provides opportunities for Productivity Engineers to significantly improve the developer experience by reporting on this powerful metric and making the underlying data visible and actionable.
#2 – Build and Test Failure Rates
Our users reported that understanding rates of build failure was collectively the second most important DPE metric Develocity provided. Although one user even called out this metric as being more important than build duration. As they put it:
“Failure rates top build duration. If the failure rate is low, then build duration becomes the next most important metric. Failure rates top everything, when builds fail all productivity is severely impacted.”
Build and test failure details are recorded in Build Scan. Develocity retains a history of these builds and allows users to view them in several ways. An overview of all builds is provided in the home pane of the Develocity interface—you can filter down to failed builds specifically, or opt to show failed and successful builds side by side.
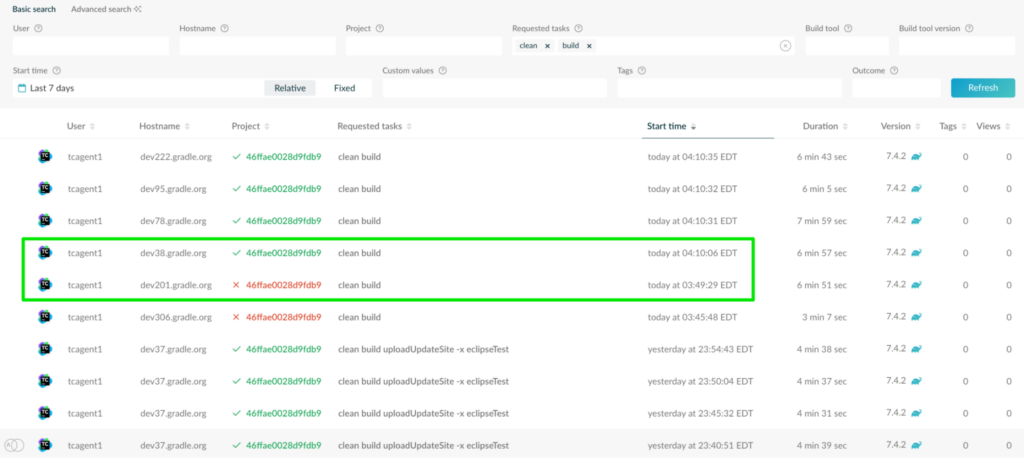
Notice the failed and successful builds in the image above. These builds ran on different hosts but ran the same tasks against the same projects. Develocity can be used to compare these two builds to determine if there were critical differences between the two that might have caused the failure. These robust insights lead to highly efficient troubleshooting.
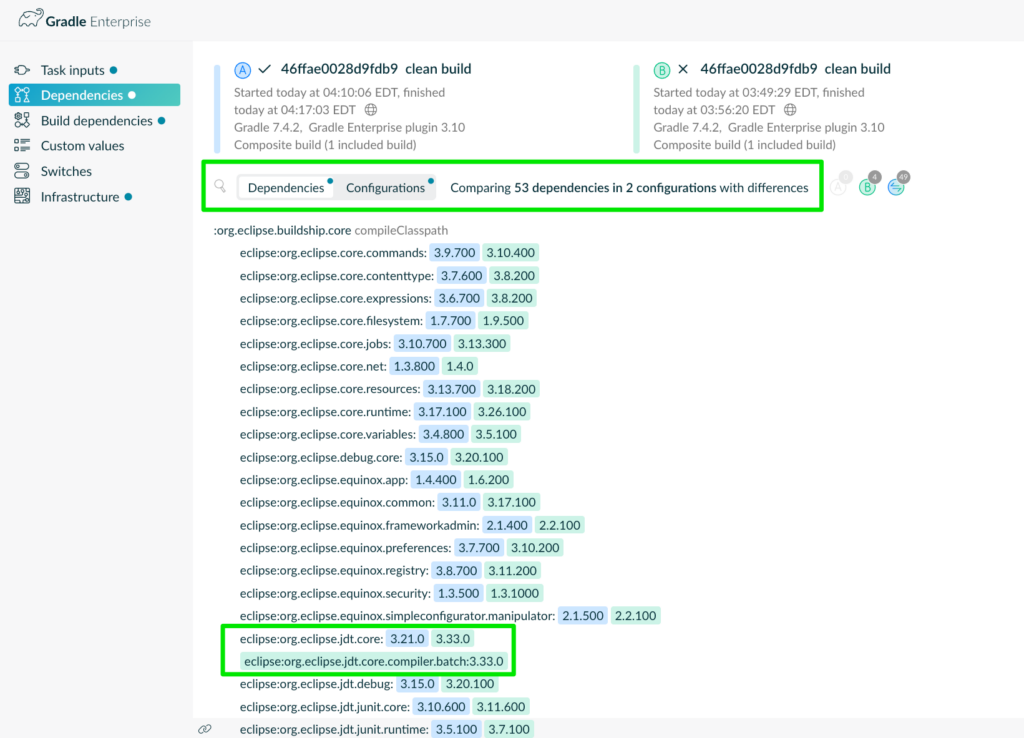
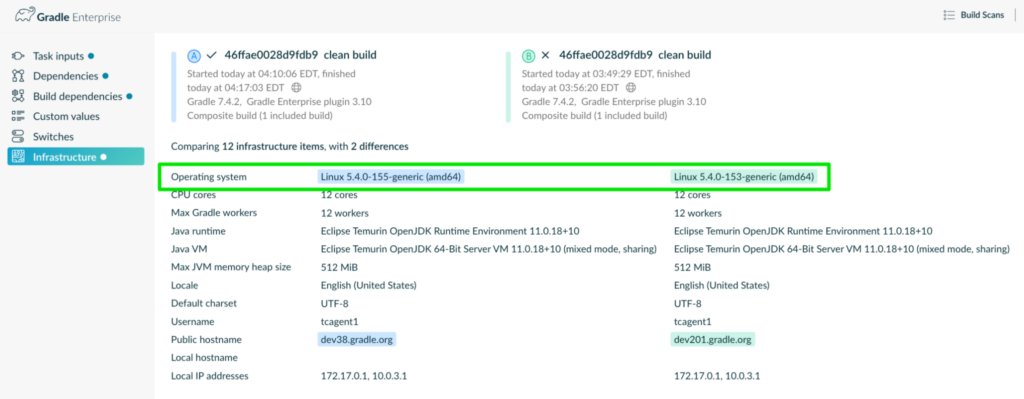
In the image above, it’s clear that there are many differences in the versions of dependencies used across both builds. The view below also indicates that there’s a minor difference in the environmental infrastructure between the two builds:
Each individual Build Scan provides engineers with self-service troubleshooting support. The failure can be explored along with the full context of the build.
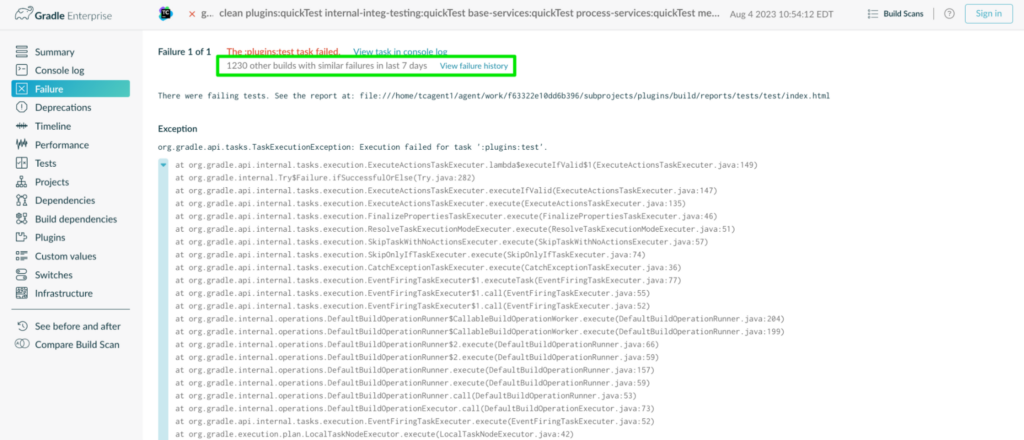
As shown above, users can also view a full failure history, providing valuable insights into the behavior of this build across engineers and automated build agents. This analysis is helpful for multiple use cases. For example, it can facilitate troubleshooting by providing a mechanism to collaborate with other engineers who’ve experienced the same failure.
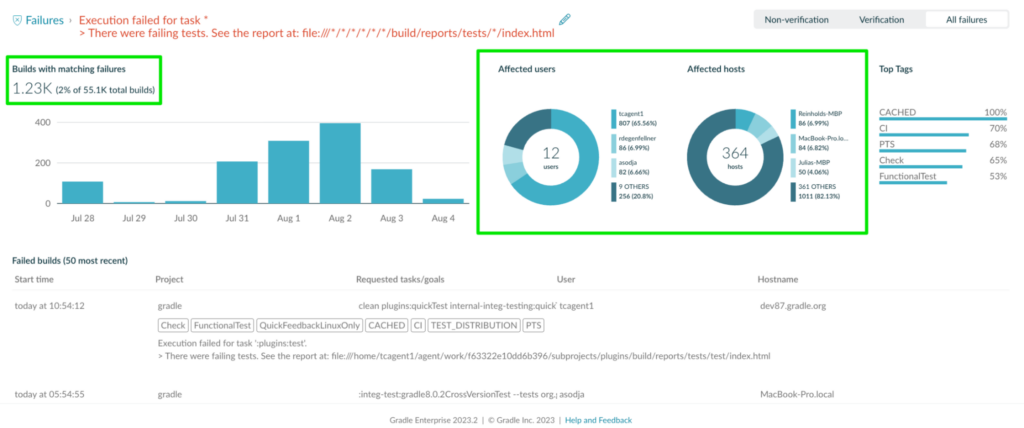
Perhaps more importantly, this data can be used to show the overall impact of certain build failures to the organization (see image above) and inform decisions on where to spend time improving the reliability of the overall toolchain. It takes the guesswork out of understanding which fixes will have the greatest positive impact on the toolchain. As one user reported:
“The most important metrics captured in Develocity would be the failures. I like the way it groups top failures over a period of time, identifying if a failure is a fluke or there’s really a trend because someone really broke the code.”
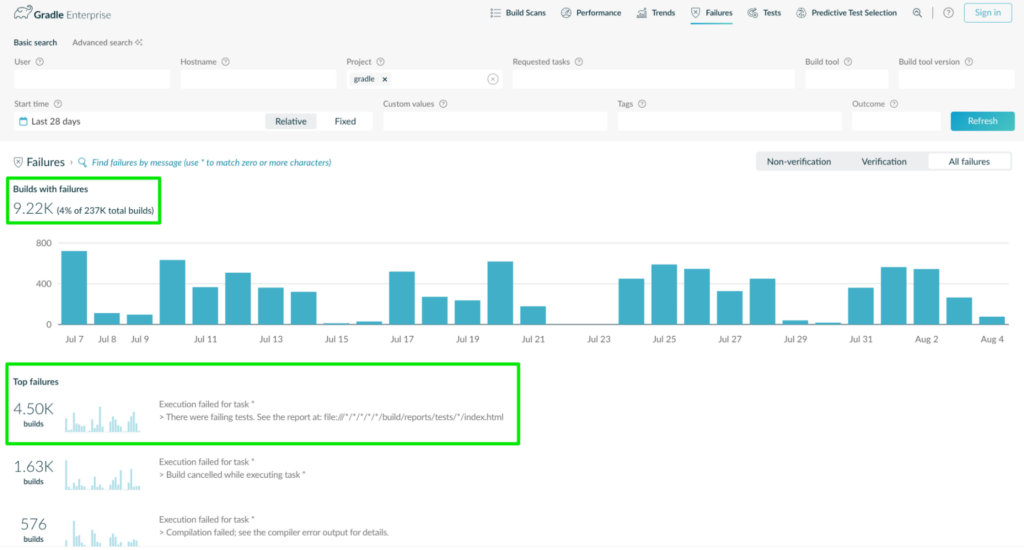
In the Failure Analytics view above, Develocity indicates that there have been around 9,220 failures over the last 28 days and that the top failure has occurred over 4,500 times in that time period. If this one failure can be mitigated, it would reduce the overall failure rate by almost half!
Test failures are tracked specifically as well, which provides a perfect segue to the third metric, test flakiness.
#3 – Test Flakiness / Non-Deterministic Tests
Last, but most certainly not least, the rate of non-deterministic or “flaky” tests was the third-most-popular DPE metric provided by Develocity, as reported by our users. Flaky tests can be a massive drag on productivity—see our recent blog: “Seven Reasons You Should Not Ignore Flaky Tests.”
Develocity provides multiple options for detecting flaky tests, from retrying failed tests automatically to comparing test signatures across multiple builds. Per-build incidence of test flakiness is captured via Build Scan and aggregated in a method similar to that used for build failures described above. This lets users understand the reliability of their test suite and make proactive improvements.
“Flaky test detection can help with stability (low failure rate) so being able to track and manage them through GE is very powerful.”
Both test class failure history and flaky test history are visualized through the “Test” pane of Develocity. Test classes can be sorted by both failure rate and rate of flakiness:
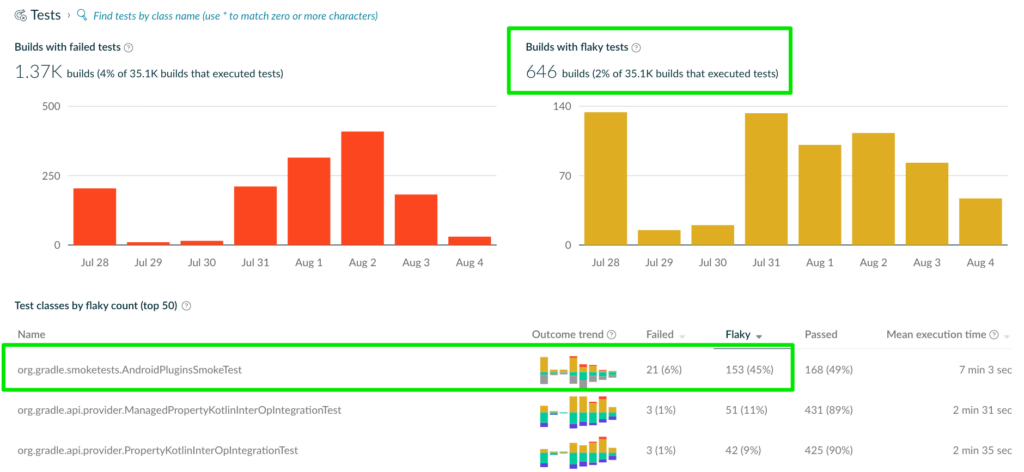
This dashboard is critical for teams who want to proactively control the reliability and consistency of their builds. Develocity offers a painless way of providing visibility into this metric, and teams can then use techniques such as “flaky test days” to ensure that flaky tests aren’t contributing to poor team productivity.
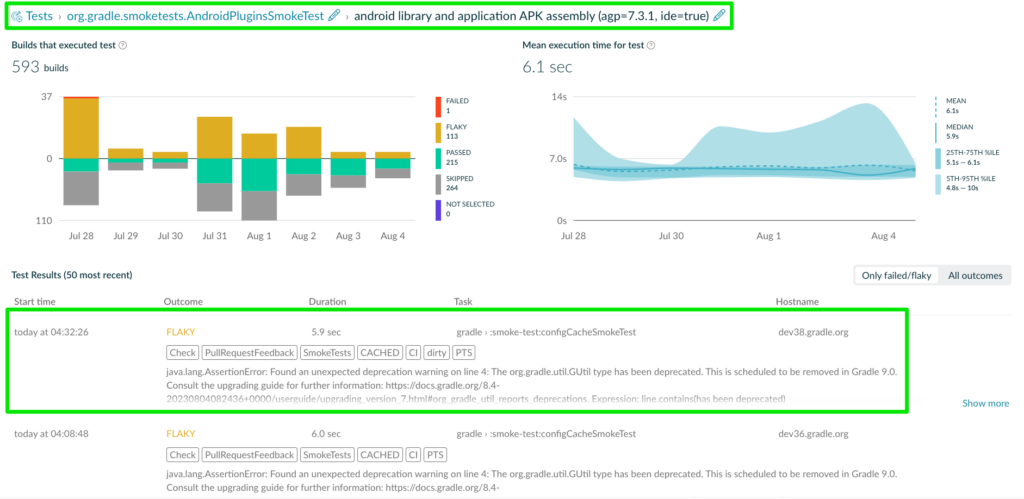
It’s clear in the screenshot above that the org.gradle.smoketests.AndroidPluginSmoketest class is highly problematic. It’s been flaky 45% of the time recently, and takes on average over seven minutes to execute.
Users can drill down further into this single test and gain even deeper insights into the individual tests executed by the test class over time:
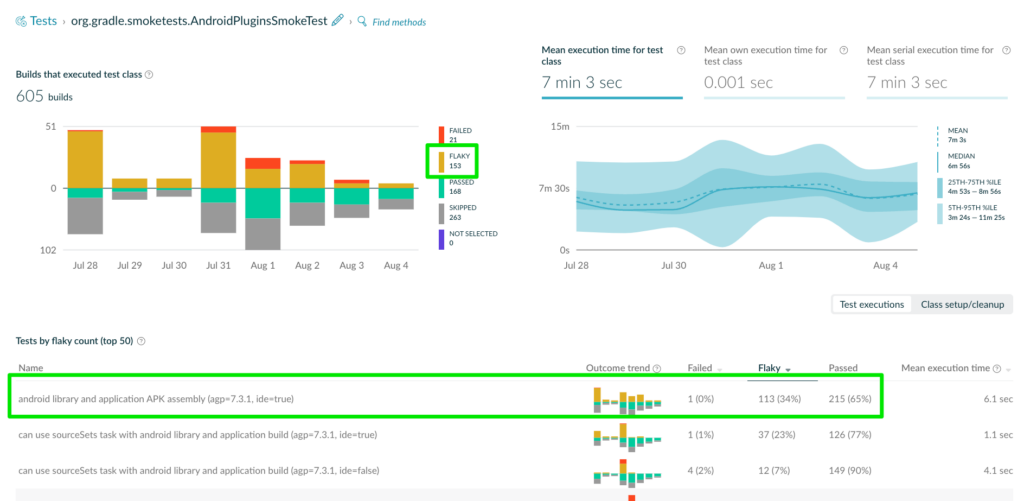
This visual indicates that the individual test “android library and applications APK assembly” test is the flakiest of all tests in this class, though it’s not the only test that’s flaky. This data is presented alongside details on the execution time associated with the test class and the frequency and outcome of builds that have executed this test over time.
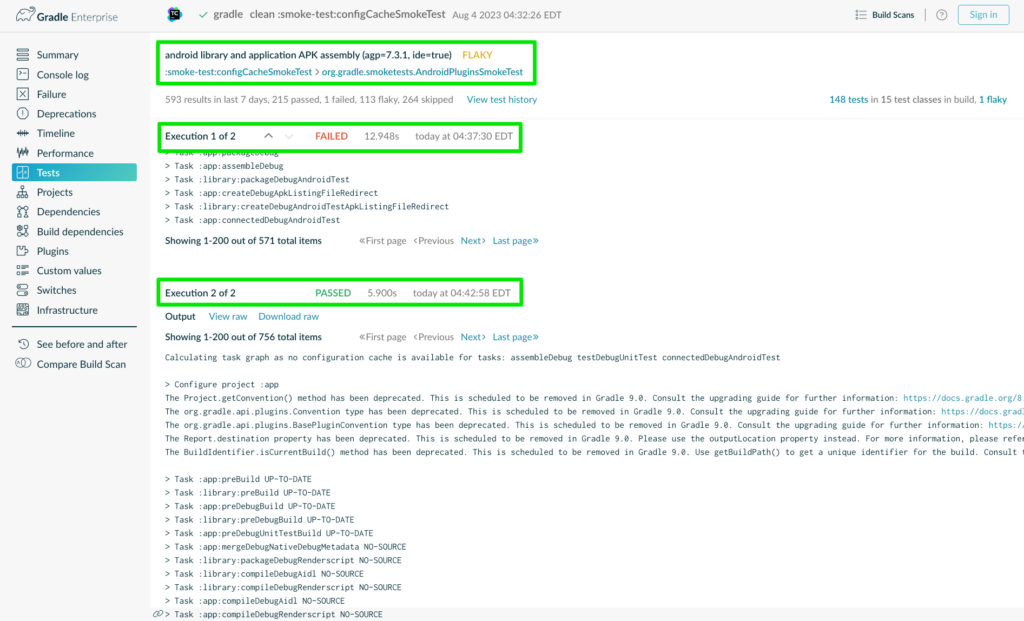
The interface allows users to go a layer deeper to better understand the behavior of an individual test:
This view lists the cross-build results of this individual test over time. Basic details about each build are displayed in this interface. Of course, users can click each row to go directly to the corresponding Build Scan and its associated test results to gain a much deeper understanding of the test behavior within the full context of the build. It shows each execution of the test and its outcome, clearly demonstrating how and where the flakiness occurred:
Wrap-Up
Develocity provides endless information about the speed, reliability, and consistency of build toolchains in the form of Developer Productivity Engineering metrics. Though every piece of data in the platform is valuable in its own way, our users have spoken—and revealed their top three DPE metrics to be Build Duration, Failure Rates, and Test Flakiness. Develocity delivers these metrics through multiple interfaces, providing a powerful and flexible platform for observing and improving Developer Experience.
Want to learn more? Check out the following resources:
- Free Build Scan – Run a free Gradle, Maven, or sbt Build Scan right now and explore the data it provides about your build!
- DPE Handbook – Check out the Developer Productivity Engineering handbook to discover more about these and other metrics and how they contribute to your team’s improved productivity
- Making SPACE for DPE – Learn how improving DPE metrics can improve all five of your organization’s SPACE dimensions