Traditional observability began as a way to visualize what happens in a system by recording logs, metrics, and tracing data. Develocity takes this further by shifting observability left and extending it across your entire software delivery pipeline—from the developer’s local machine all the way to CI. By recording the end-to-end build process, regardless of your tech stack or toolchain, Develocity empowers teams to measure, improve, and communicate performance at all levels, making your engineers stakeholders in business outcomes.
Unlock engineering power in an AI-dominated development landscape
Develocity 360 unlocks never-before-seen insights into software behavior and makes them instantly accessible via Agentic AI, so you can redirect your engineering capacity to accelerate delivery, reduce incidents, and build better software.
Immediate insights for proactive troubleshooting & issue resolution
Reduce the time you spend troubleshooting with immediate access to data to surface root cause—no more manually sifting through logs. Develocity’s Build Scan® data is fed into easy-to-use dashboards so you can track build and test failures, compare builds over time, identify dependency issues, and more, at both the individual and organizational level.
Resource & performance optimization
If you have long CI queues, your instinct might be to throw more compute resources at it. But if you also knew that 90% of your CI cores were idle, you would look at parallelizing your builds. Develocity ensures you identify the right issue and gives you the data you need to solve it.
Pipeline reliability & software delivery excellence
While GenAI accelerates coding and experimentation, it also introduces challenges to code quality, comprehension, batch sizing, pipeline friction, troubleshooting complexity, and regulatory compliance. Develocity shifts observability left to ensure you uncover and address issues early before they impact delivery.
We surface your data in the moment you need it, in the format you choose
Agentic AI
Request more infoGet data, insights, and recommendations via Agentic AI. Developers can query or prompt the AI agent directly from the IDE for instant analysis and feedback on any issue.
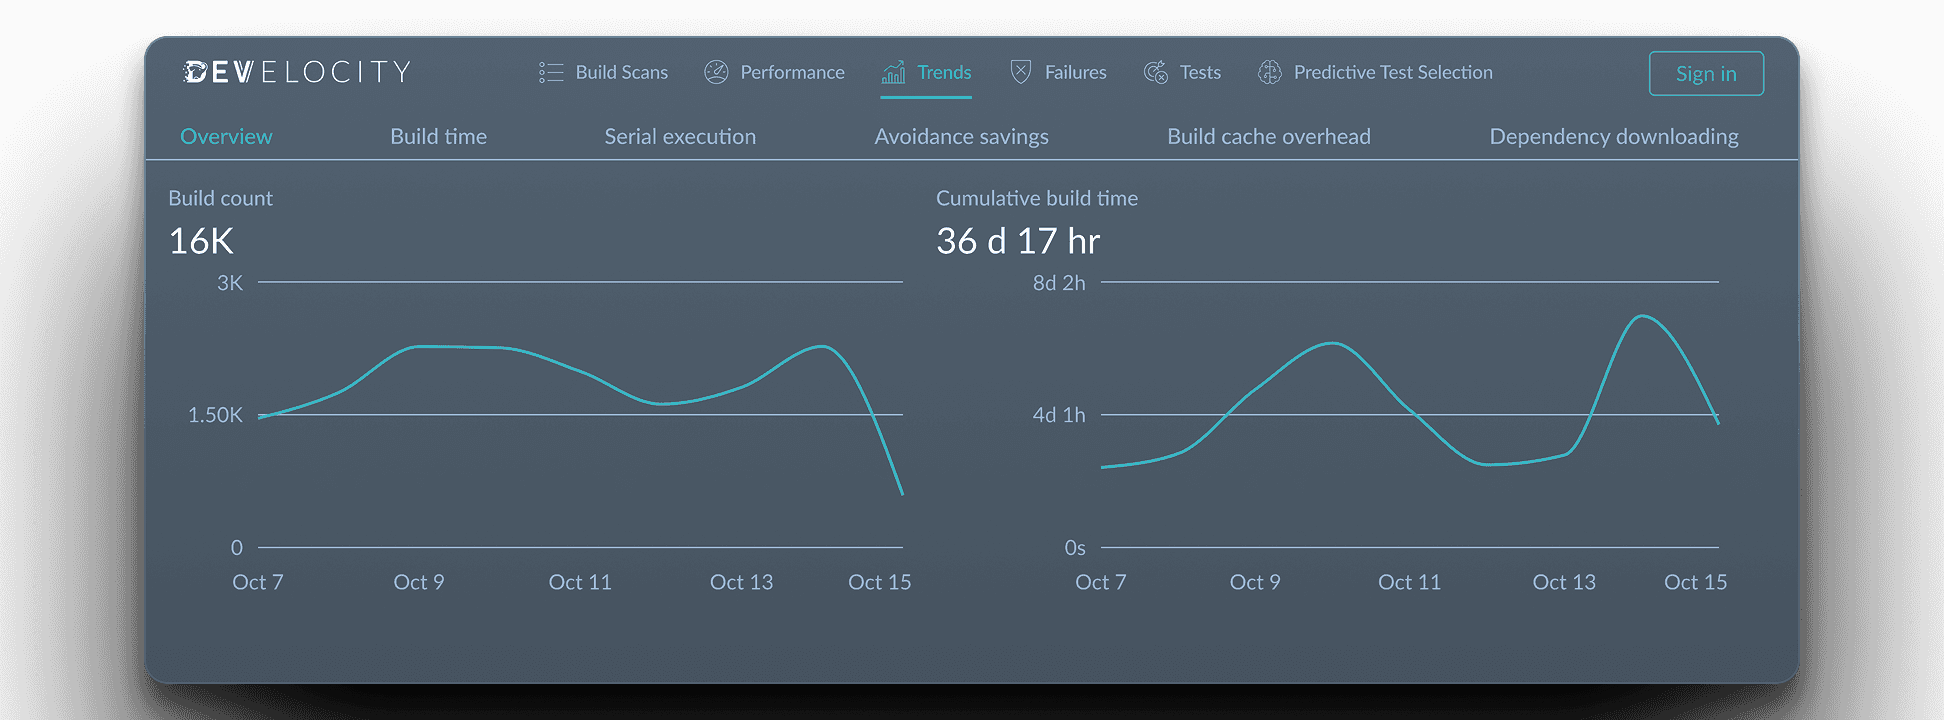
Out-of-the-box dashboards
Request more infoView metrics and trends for all local and CI build performance data, including build times, user/project-specific data, test method, dependency resolution, and more.
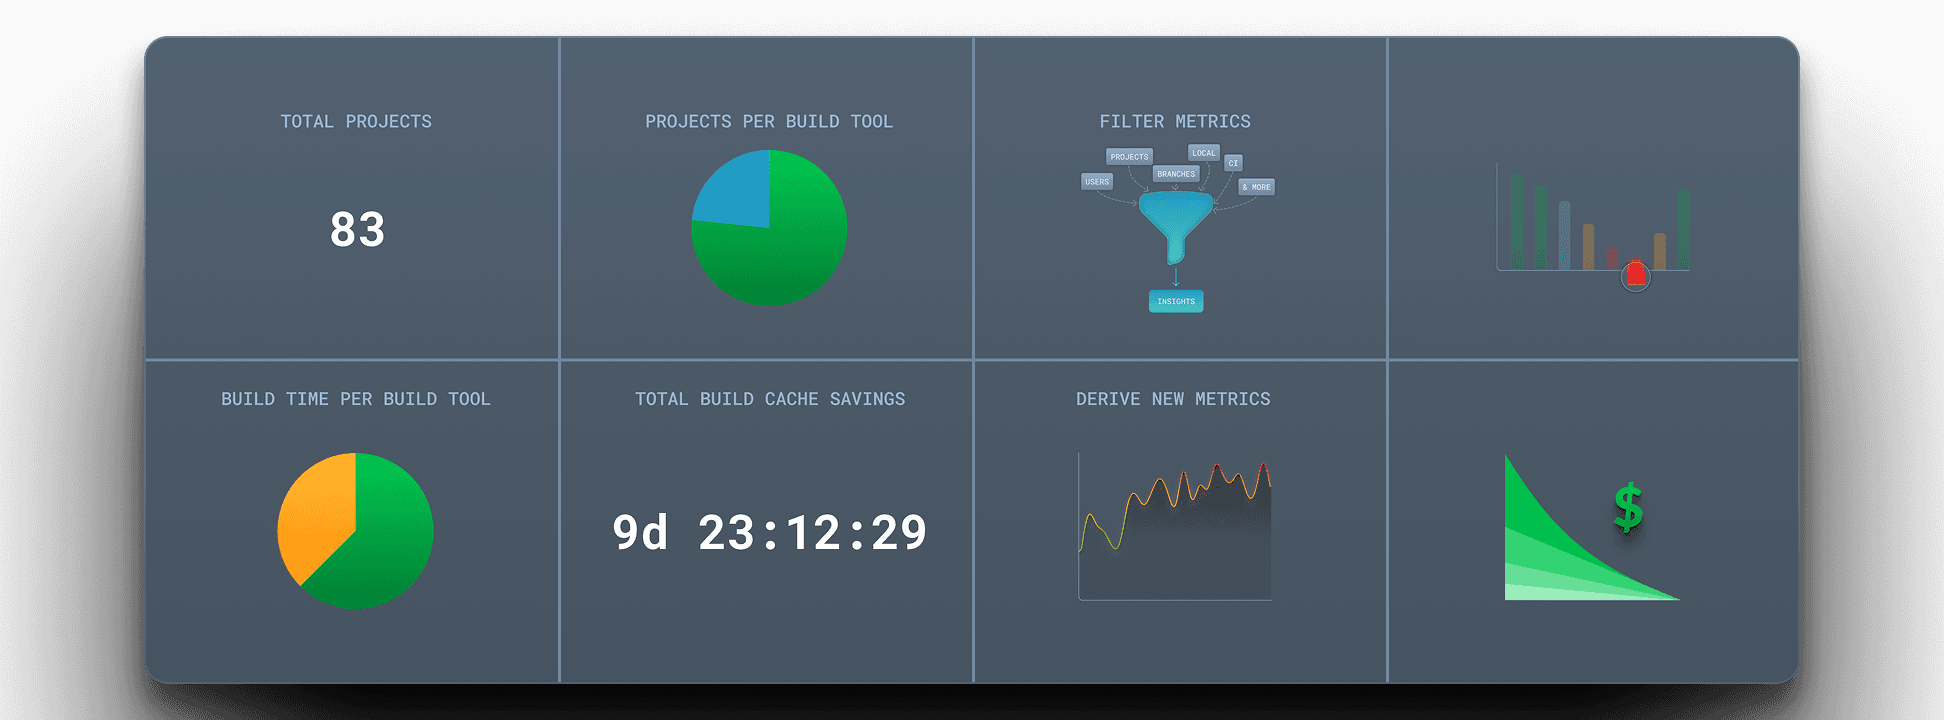
Develocity Analytics
Request more infoBy feeding data to your chosen reporting/BI tool (such as Grafana), Develocity Analytics provides an extensible platform for data observability and analysis as well as customizable reporting and visualizations.
Learn more about Develocity
Dive deeper into Develocity 360
Learn more about how Develocity 360 helps modern software development teams meet the growing demand for observability across both local and CI build processes.
Unlock your DORA potential with Develocity
Find out how Develocity enables DORA capabilities like continuous delivery, small batches, fast feedback, enhanced observability, and automated compliance in modern software delivery.

Get the whitepaper: AI's impact on software delivery
Ready to harness the power of GenAI without disrupting your software delivery? Get our whitepaper here.