Gradle Enterprise 2019.3
Gradle Enterprise 2019.3 introduces build failure analysis for triaging and diagnosing unexpected build failures for Gradle and Maven builds, test results and console logs for Maven builds, improved support for the latest Gradle dependency management features, and more.
Read on for more details.
Use version 1.2.8 of the Gradle Enterprise Maven extension, and version 2.4.2 of the Gradle build scan plugin for optimal usage of Gradle Enterprise.
Highlights
Build failure analysis
This release of Gradle Enterprise includes tools for identifying and investigating build failure patterns within your organization.
The top failures report shows the most frequent Gradle and Maven build failures, grouped by cause and charted over time.
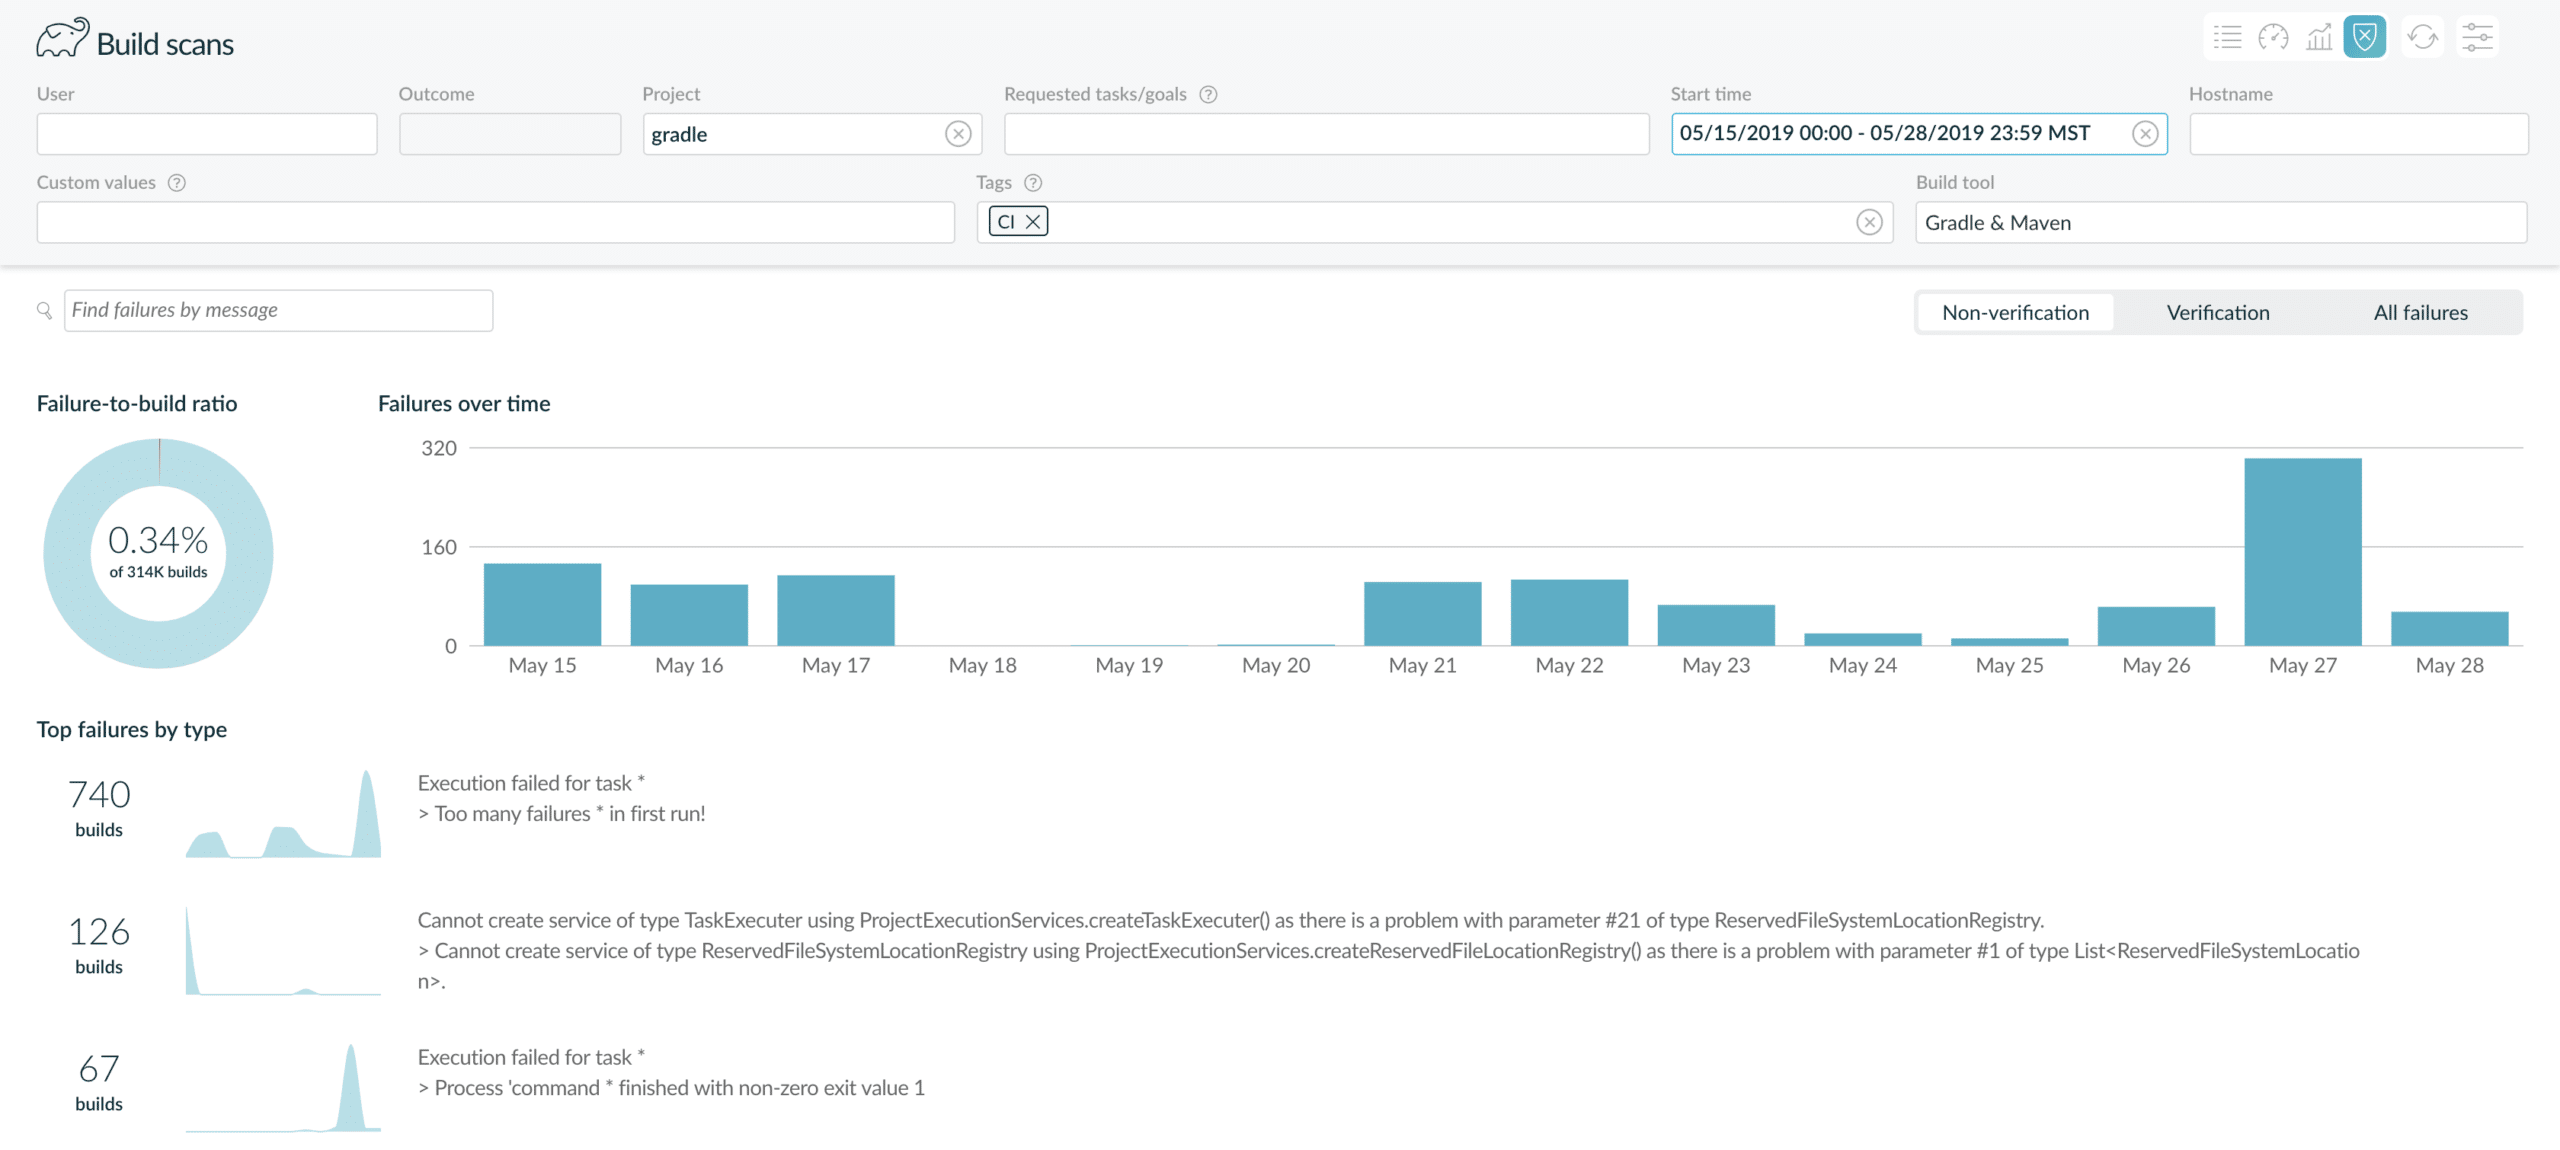
Gradle Enterprise partitions source code verification failures (compiling, linking, testing, linting, and so on) from non-verification failures. This will surface problems such as build configuration or infrastructure failures that are likely to be unexpected and disruptive.
Selecting a failure initiates a search for all occurrences of that failure; along with breakdowns by day, user, build hostname, and common tags.
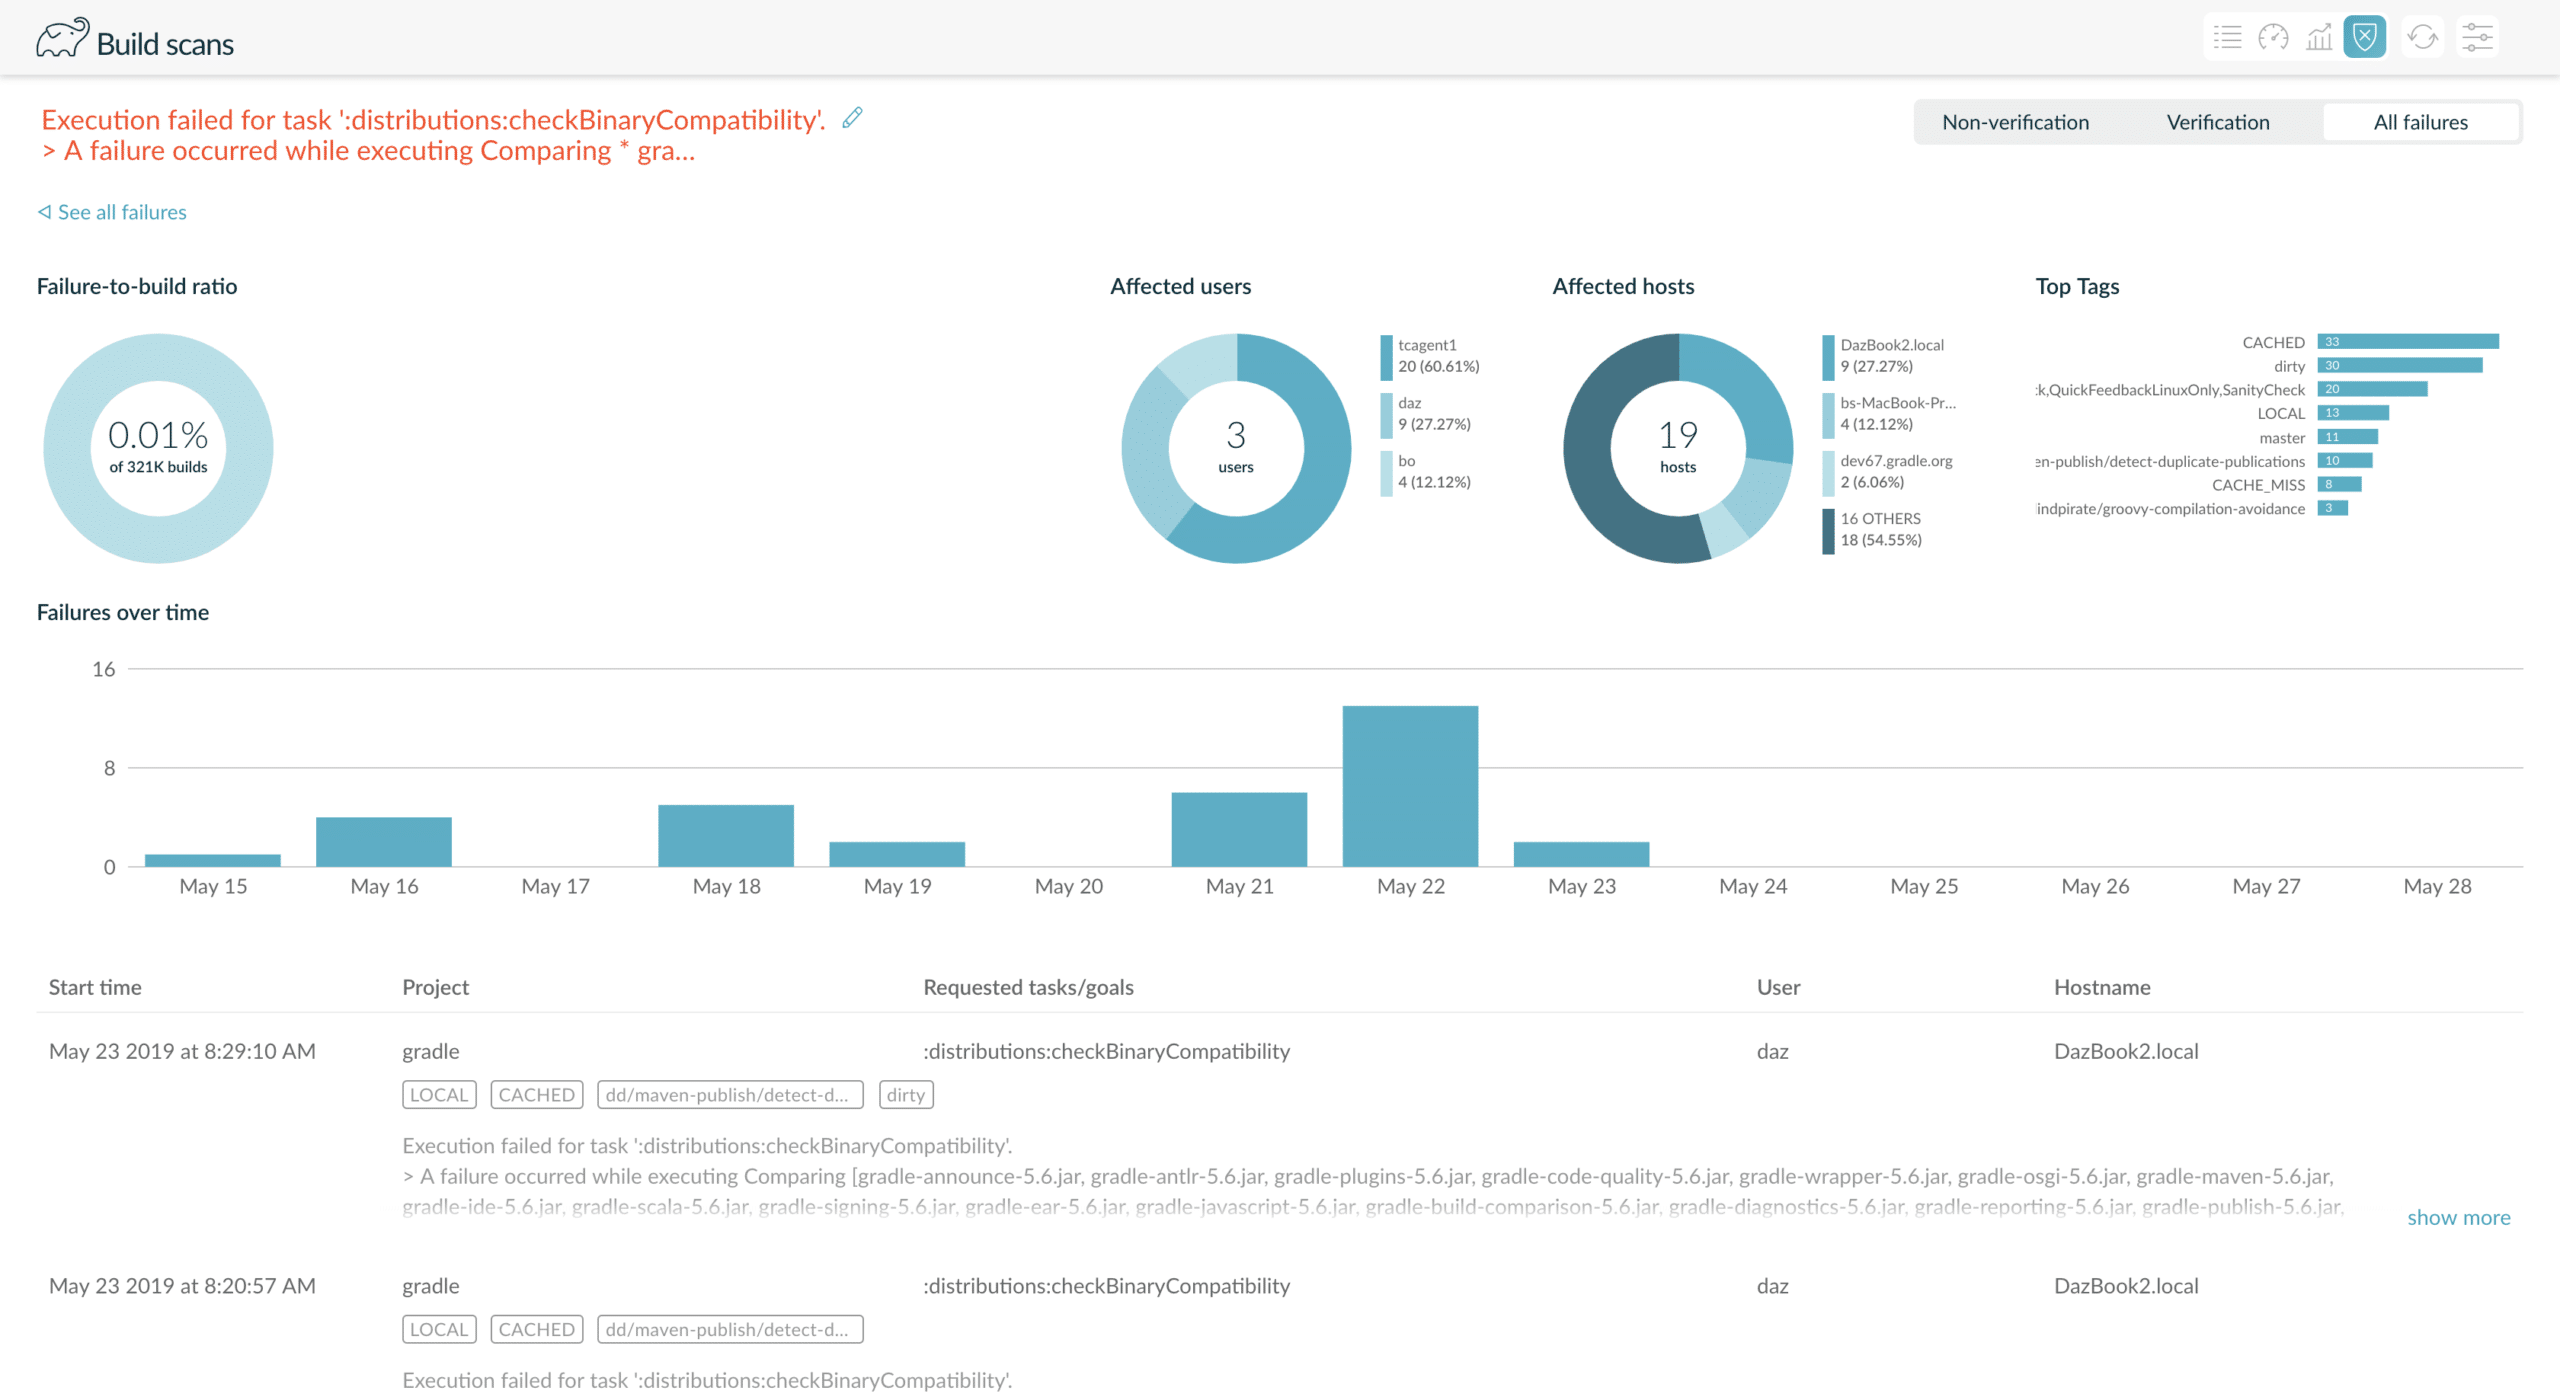
You can search for failures you’re interested in by their message. For example, you can search for “*https://your.artifacthost.com/*” to quickly see how often builds fail due to a repository being flaky or offline.
Learn more in this blog post introducing the failures dashboard.
Test results for Maven builds in build scans
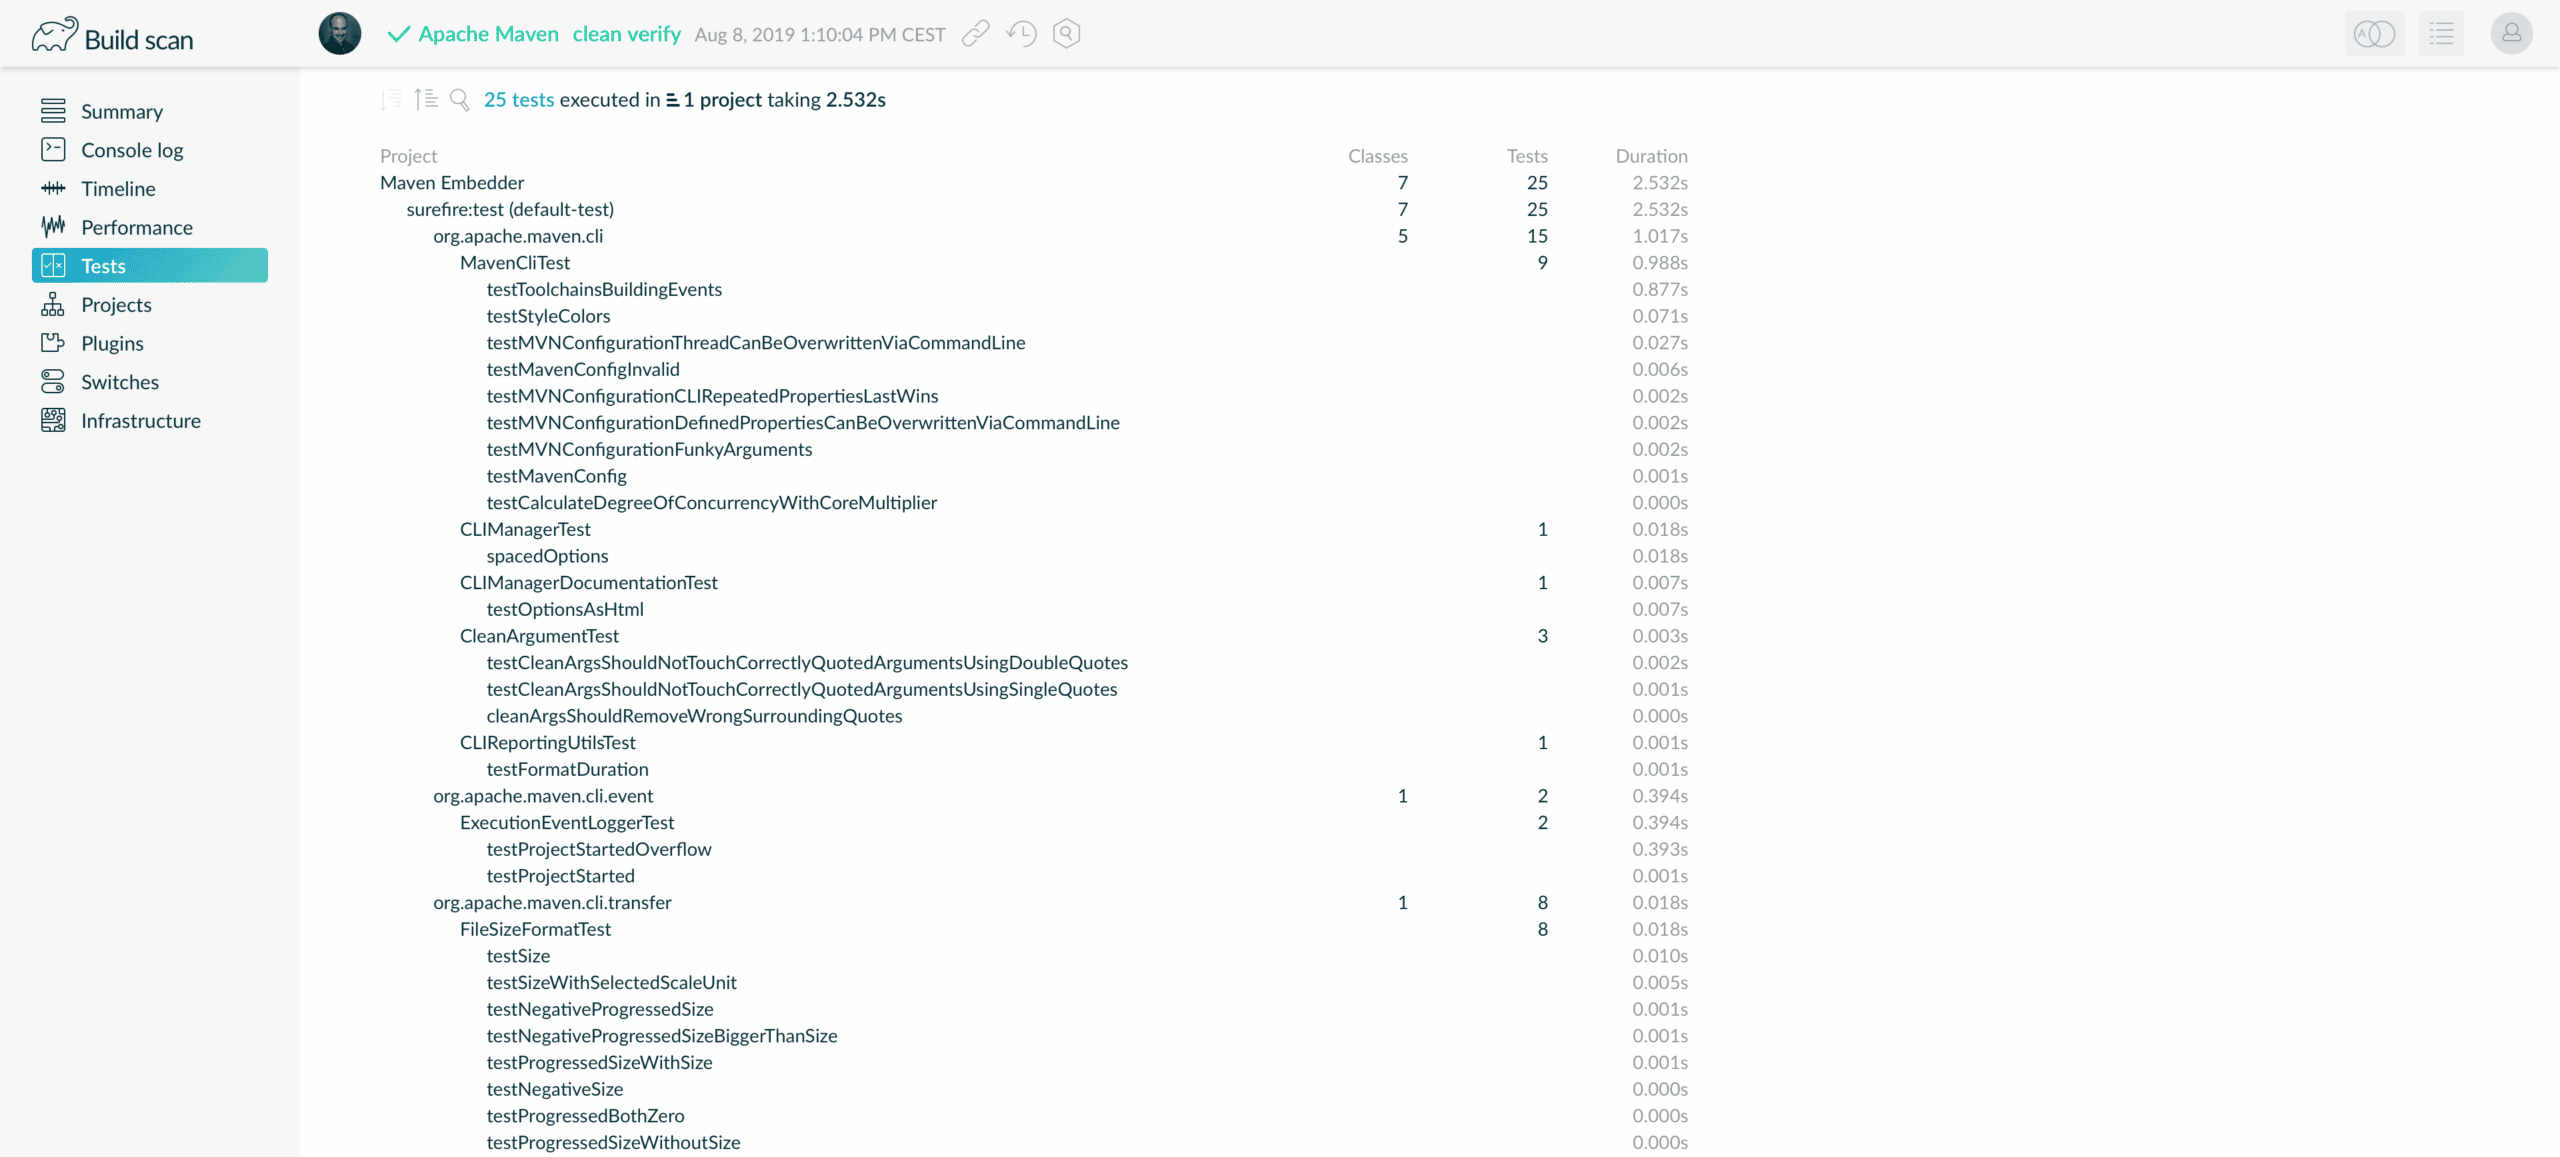
Build scans now include the results of all tests executed by the Surefire or Failsafe plugins when using JUnit 4, JUnit 5 or TestNG test execution frameworks.
The build scan summary indicates the longest running tests of the build.

The tests view lists all executed tests, slowest to fastest. The tests can also be viewed by project, or be filtered to only the failed tests.
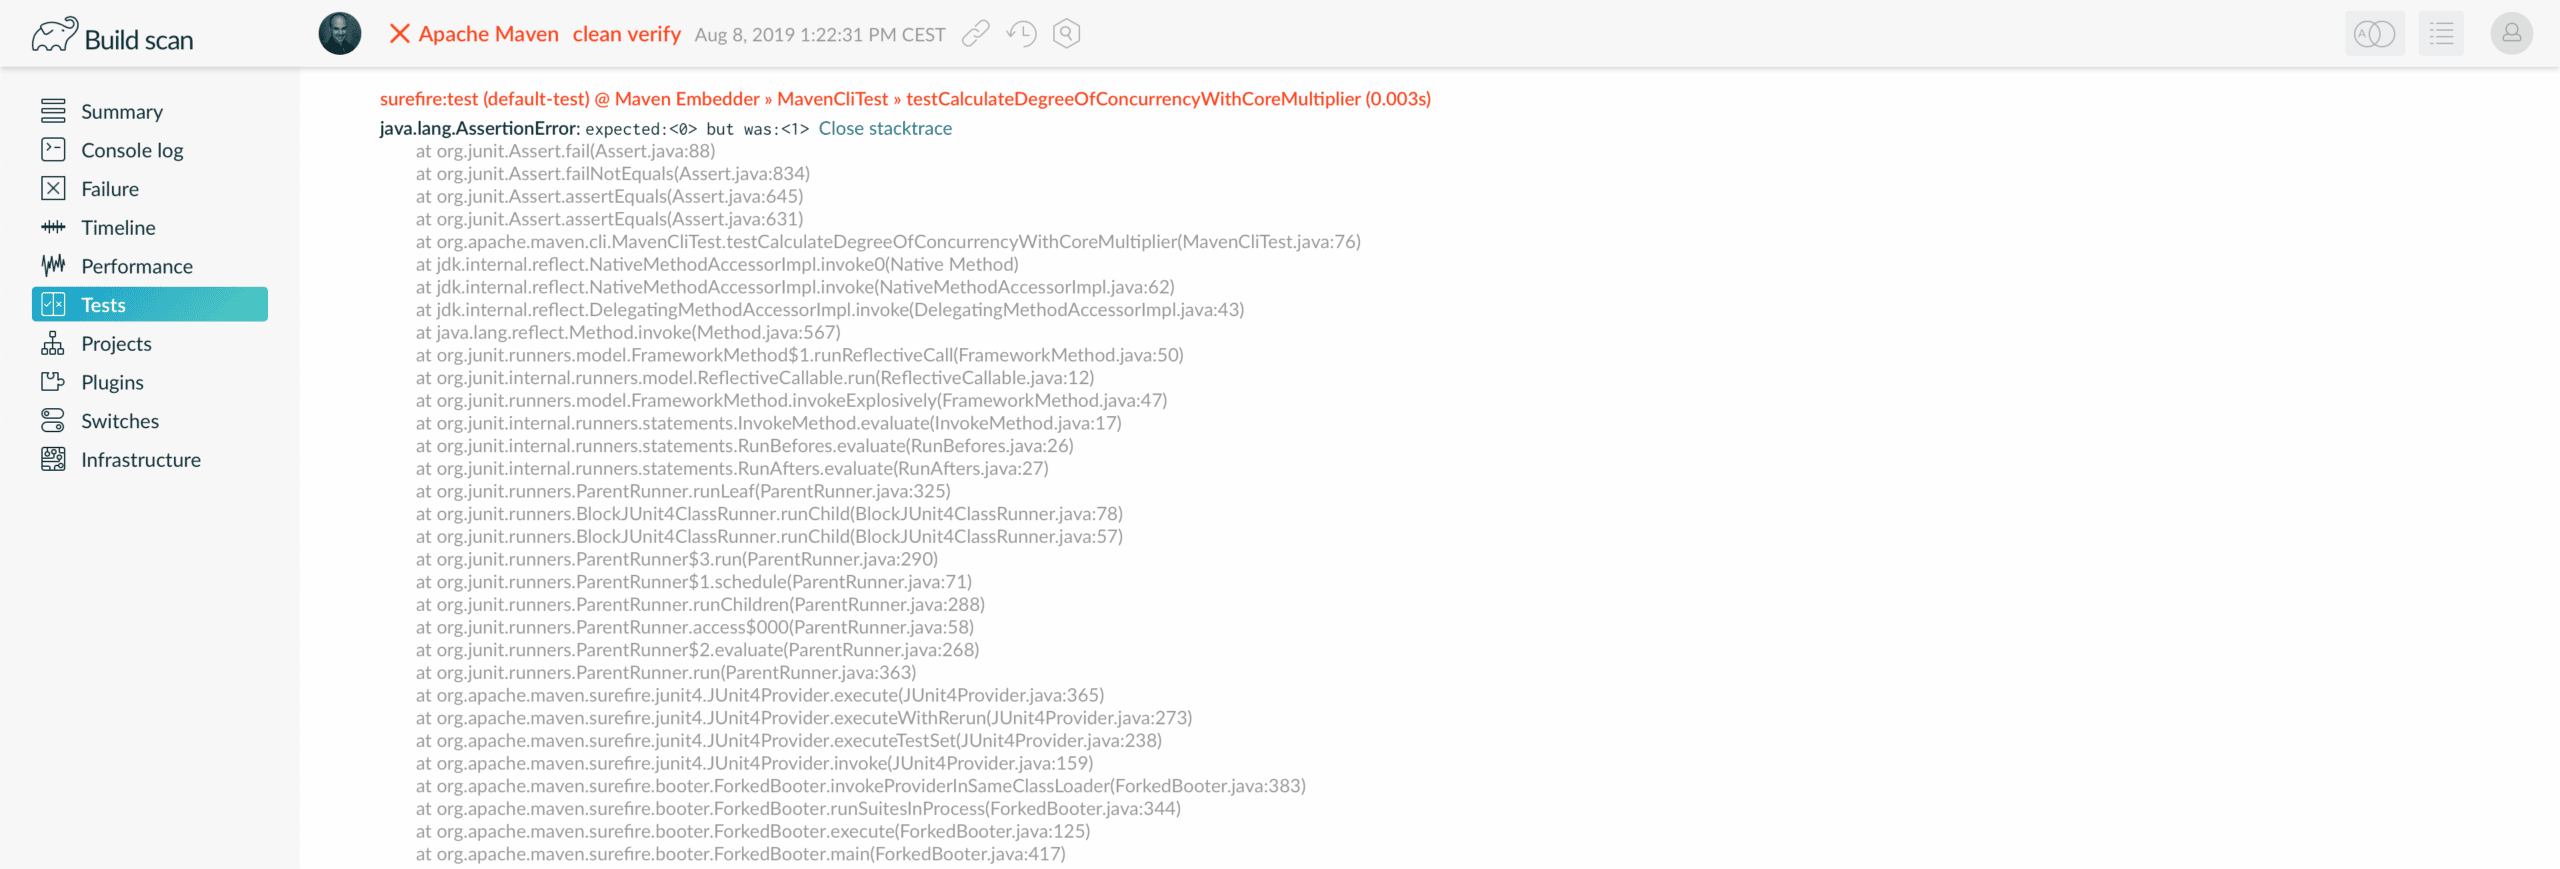
Failed tests can be clicked to see the failure exception for the test.
Console logging for Maven builds in build scans
Build scans now also reproduce the console logging for Maven builds. This makes it easier to share and collaboratively debug builds.
The console log can be filtered for a given goal execution, which is particularly useful for the intertwined logging of builds executed in parallel.

Workspace build history for Maven builds
Maven build scans now provide easy access to build scans of earlier and later builds of the same workspace (i.e. the same project directory or checkout).

This feature is particularly useful when remotely debugging an unexpected local build failure as it allows inspecting and comparing all builds of a session of builds.
Dependency download time visualization
The build performance and trends dashboards now visualize how much build time was spent obtaining dependencies.
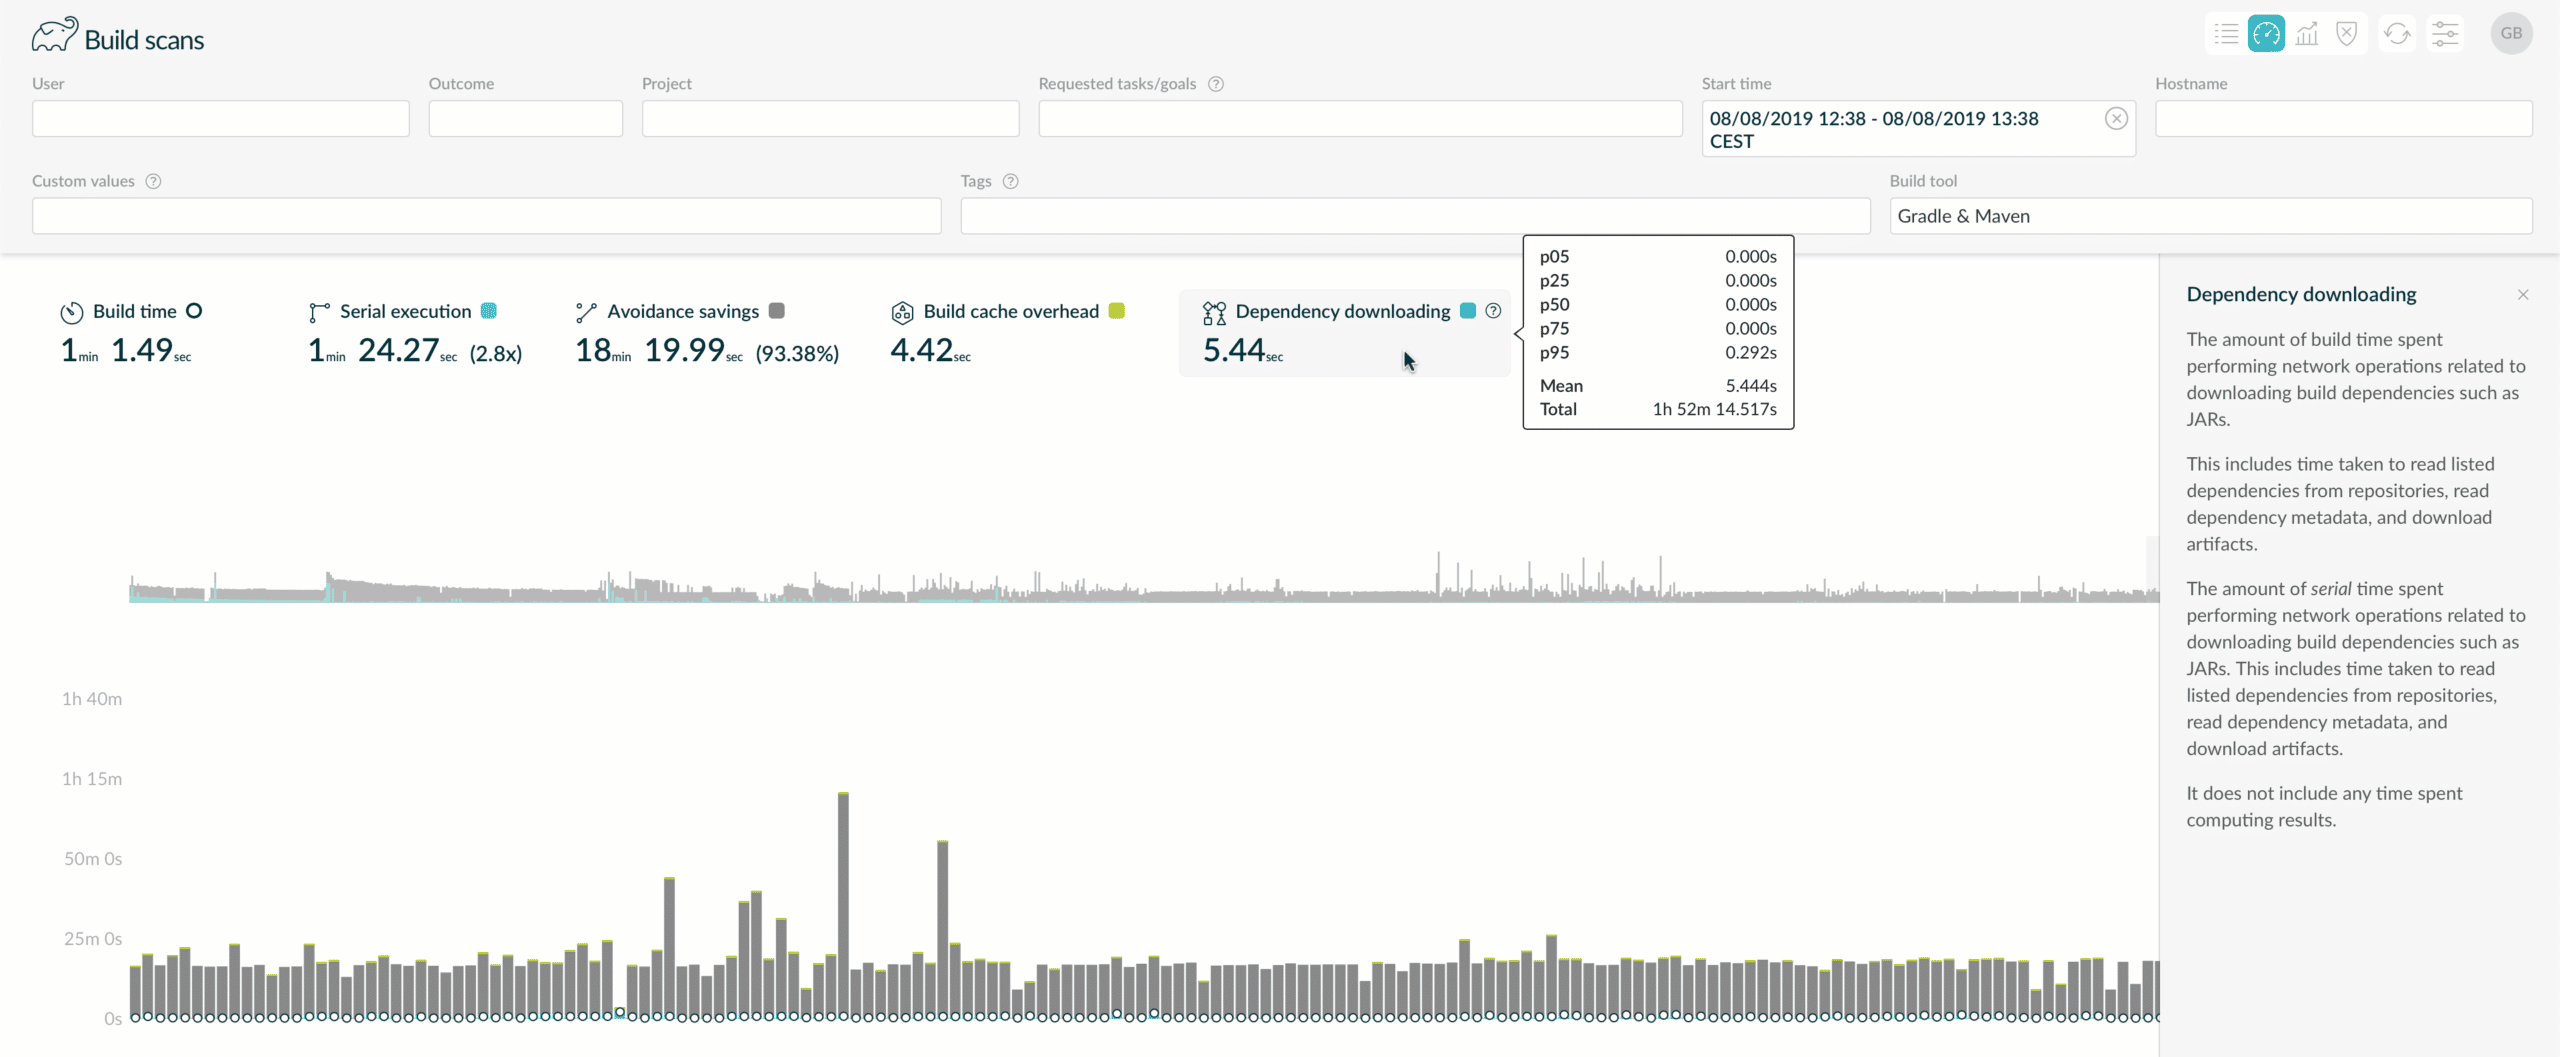
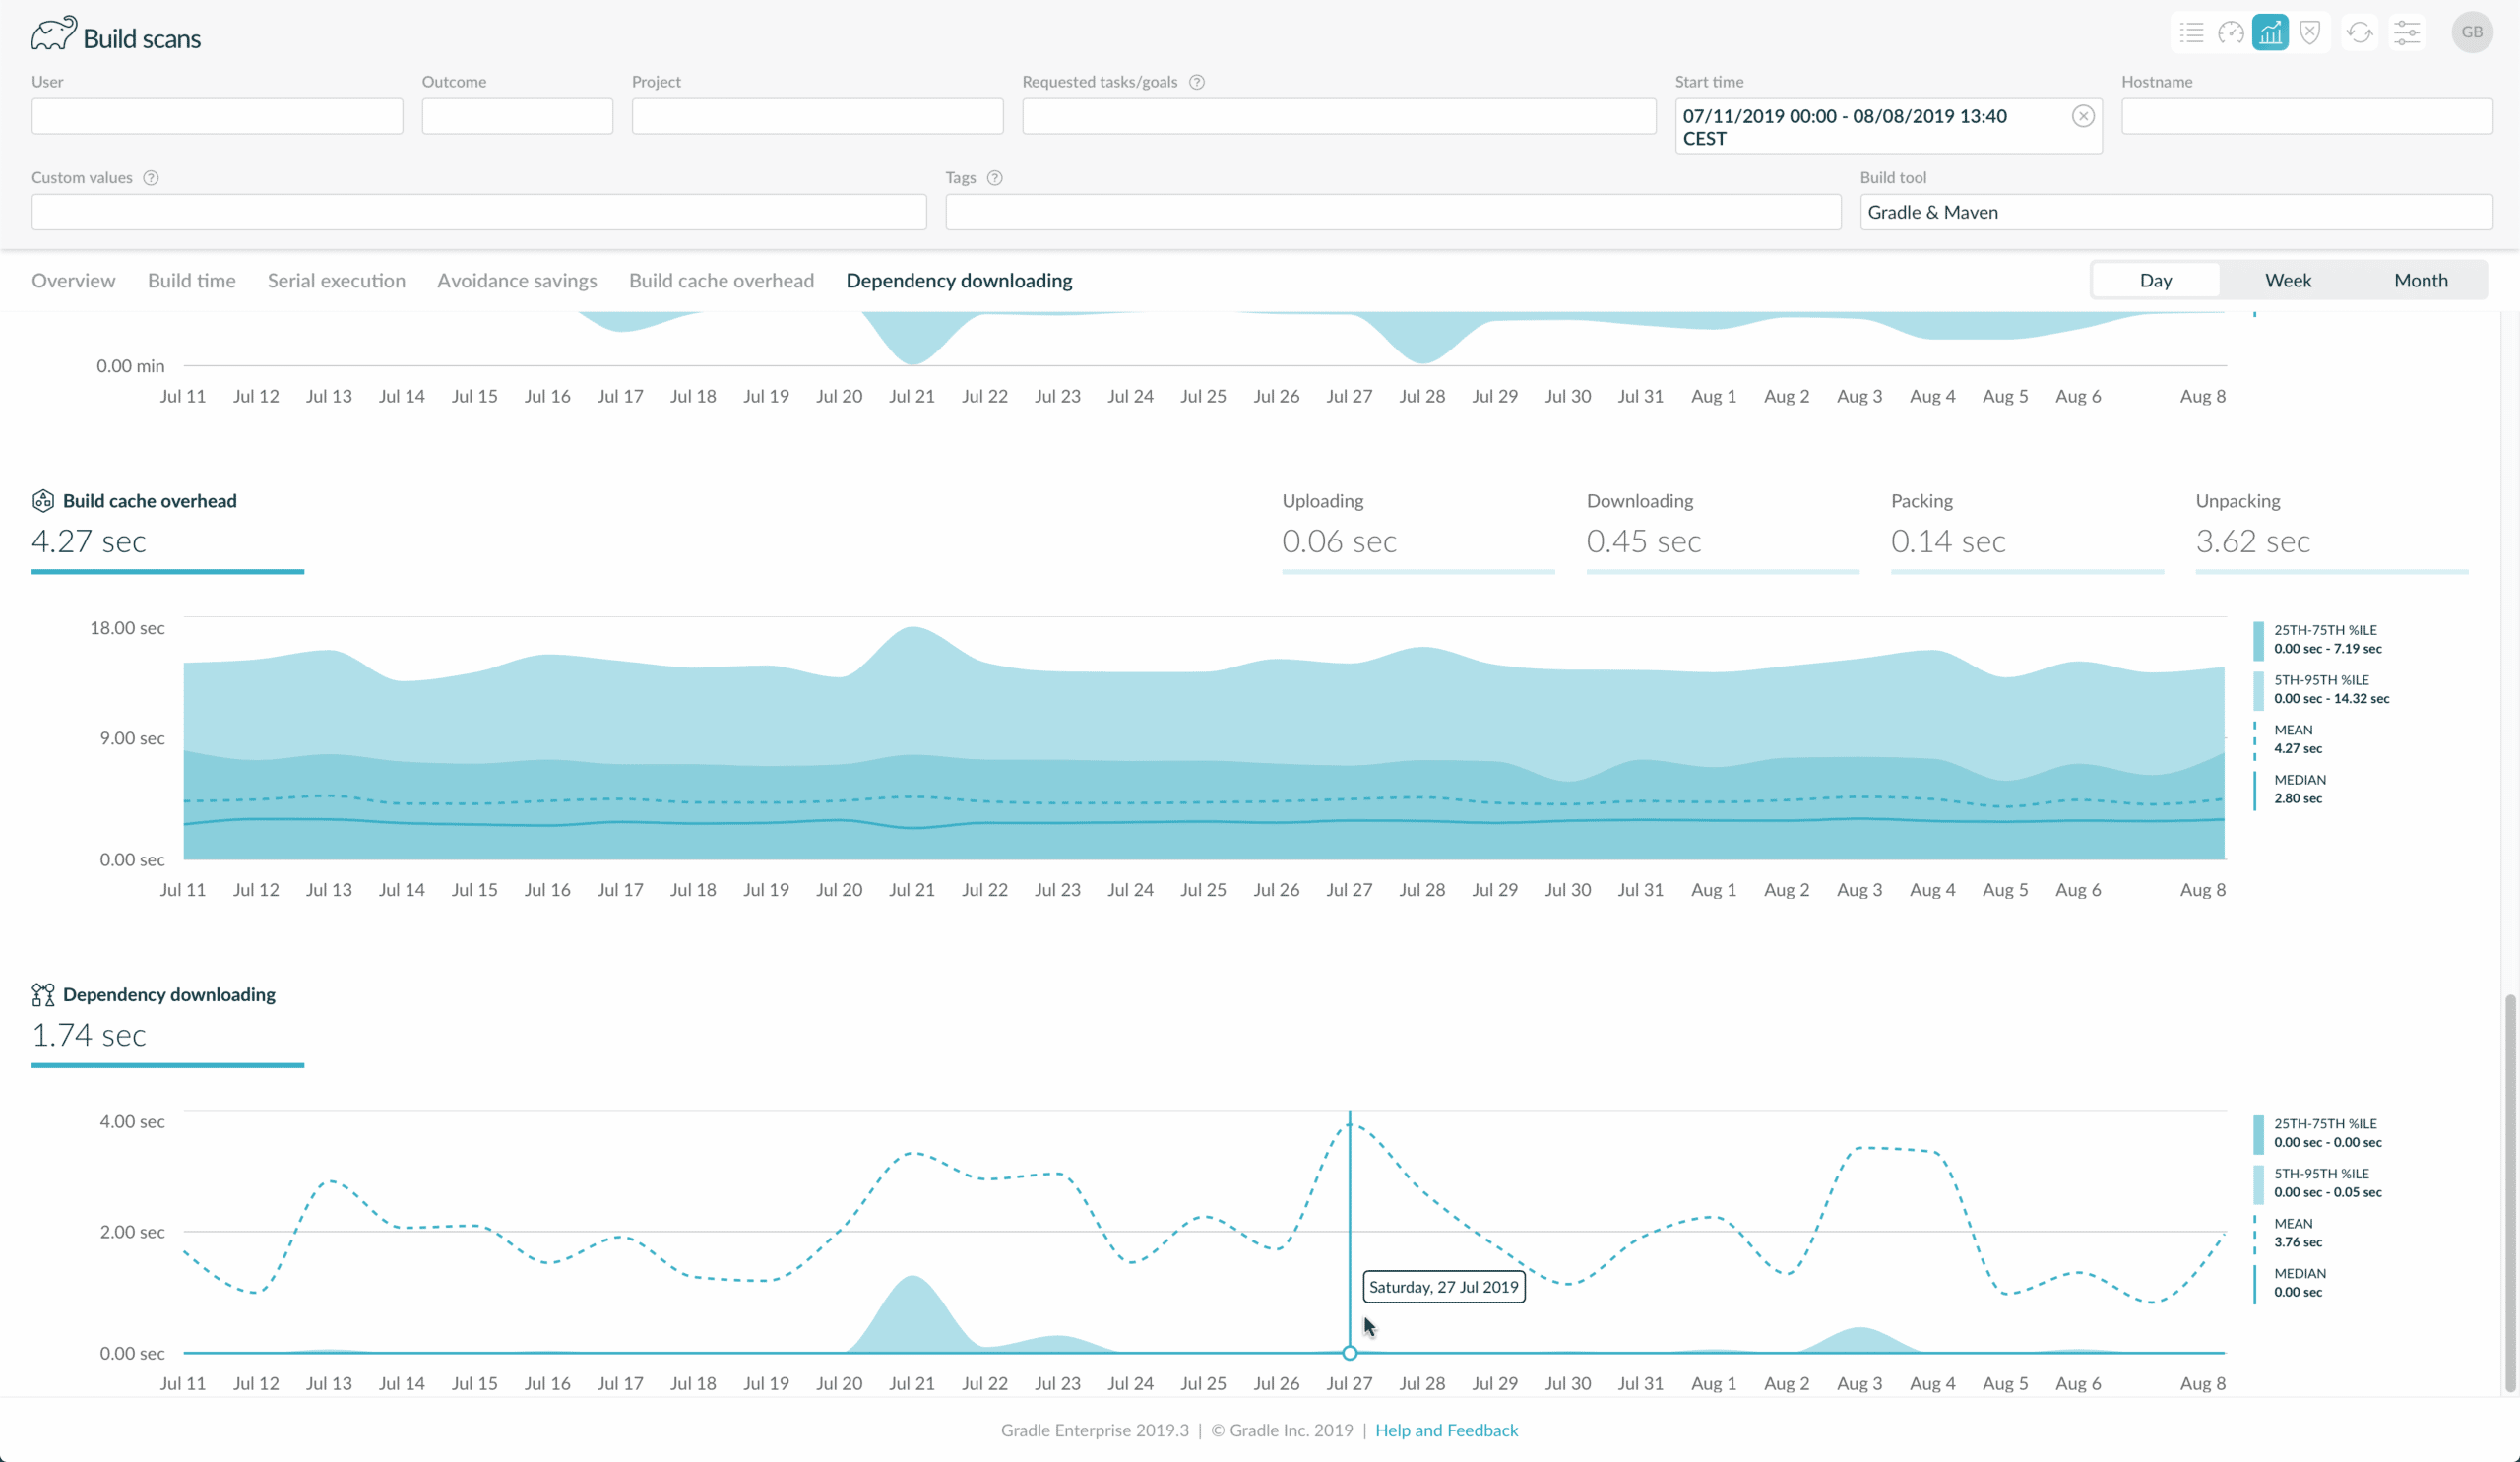
This visualization is particularly useful for identifying the build time cost of ephemeral CI builds (i.e. CI builds that do not have access to any persistent file storage for local dependency caches), poor network performance, or frequent dependency changes (e.g. snapshots). It can also be used to measure and confirm potential improvements such as use of dependency repository proxies.
More fine-grained Gradle task duration breakdown in build scans
The details inspector of a task within the Timeline section of the build scan now indicates how much time was spent downloading dependencies and how much time was spent doing the actual task work (e.g. compiling code). This can be used to diagnose long task execution times.
If a task is the first executed that requires a set of dependencies, they must be resolved before the task can do its work. This time is included in the overall task duration visualized in build scans, but isolated in the details inspector.
Before and after performing a task’s work (i.e. executing its actions), Gradle must perform internal work such as inspecting the task’s inputs and outputs. The discrepancy between the task action execution time and the overall task duration effectively indicates the cost of this internal work.

Enhanced Gradle dependency insights
Over the last several releases, Gradle has gained new dependency management capabilities such as dependency variants, rich version constraints, and platforms. Build scans for Gradle builds now more thoroughly visualize these new features and have been improved with more search functionality.
It is now possible to filter the dependencies visualization by project and configuration. This makes it easier to investigate dependency graphs of large multi-project builds.

The new “Versions” tab in the dependency inspector shows the different requested dependencies that resolved to the dependency being inspected due to substitution. This makes it much easier to identify the other dependencies that caused a particular dependency to be substituted.

When a dependency selection occurs as the result of conflict resolution and/or resolution rules, the dependency inspector now shows all of the reasons that led to the selection where previously only one was shown.

Platform and dependency constraints are now clearly marked in the dependency details view. These types of dependencies are used when leveraging Maven BOMs or when using dependency platforms directly.

Gradle supports variant-aware dependency management, where different variants of a dependency can be selected based on attributes and capabilities (e.g. debug vs. release). Build scans now indicate the variant name of a dependency when more than one variant of the same dependency are present in a given configuration. The variant name, attributes and capabilities are also visible in the details inspector.
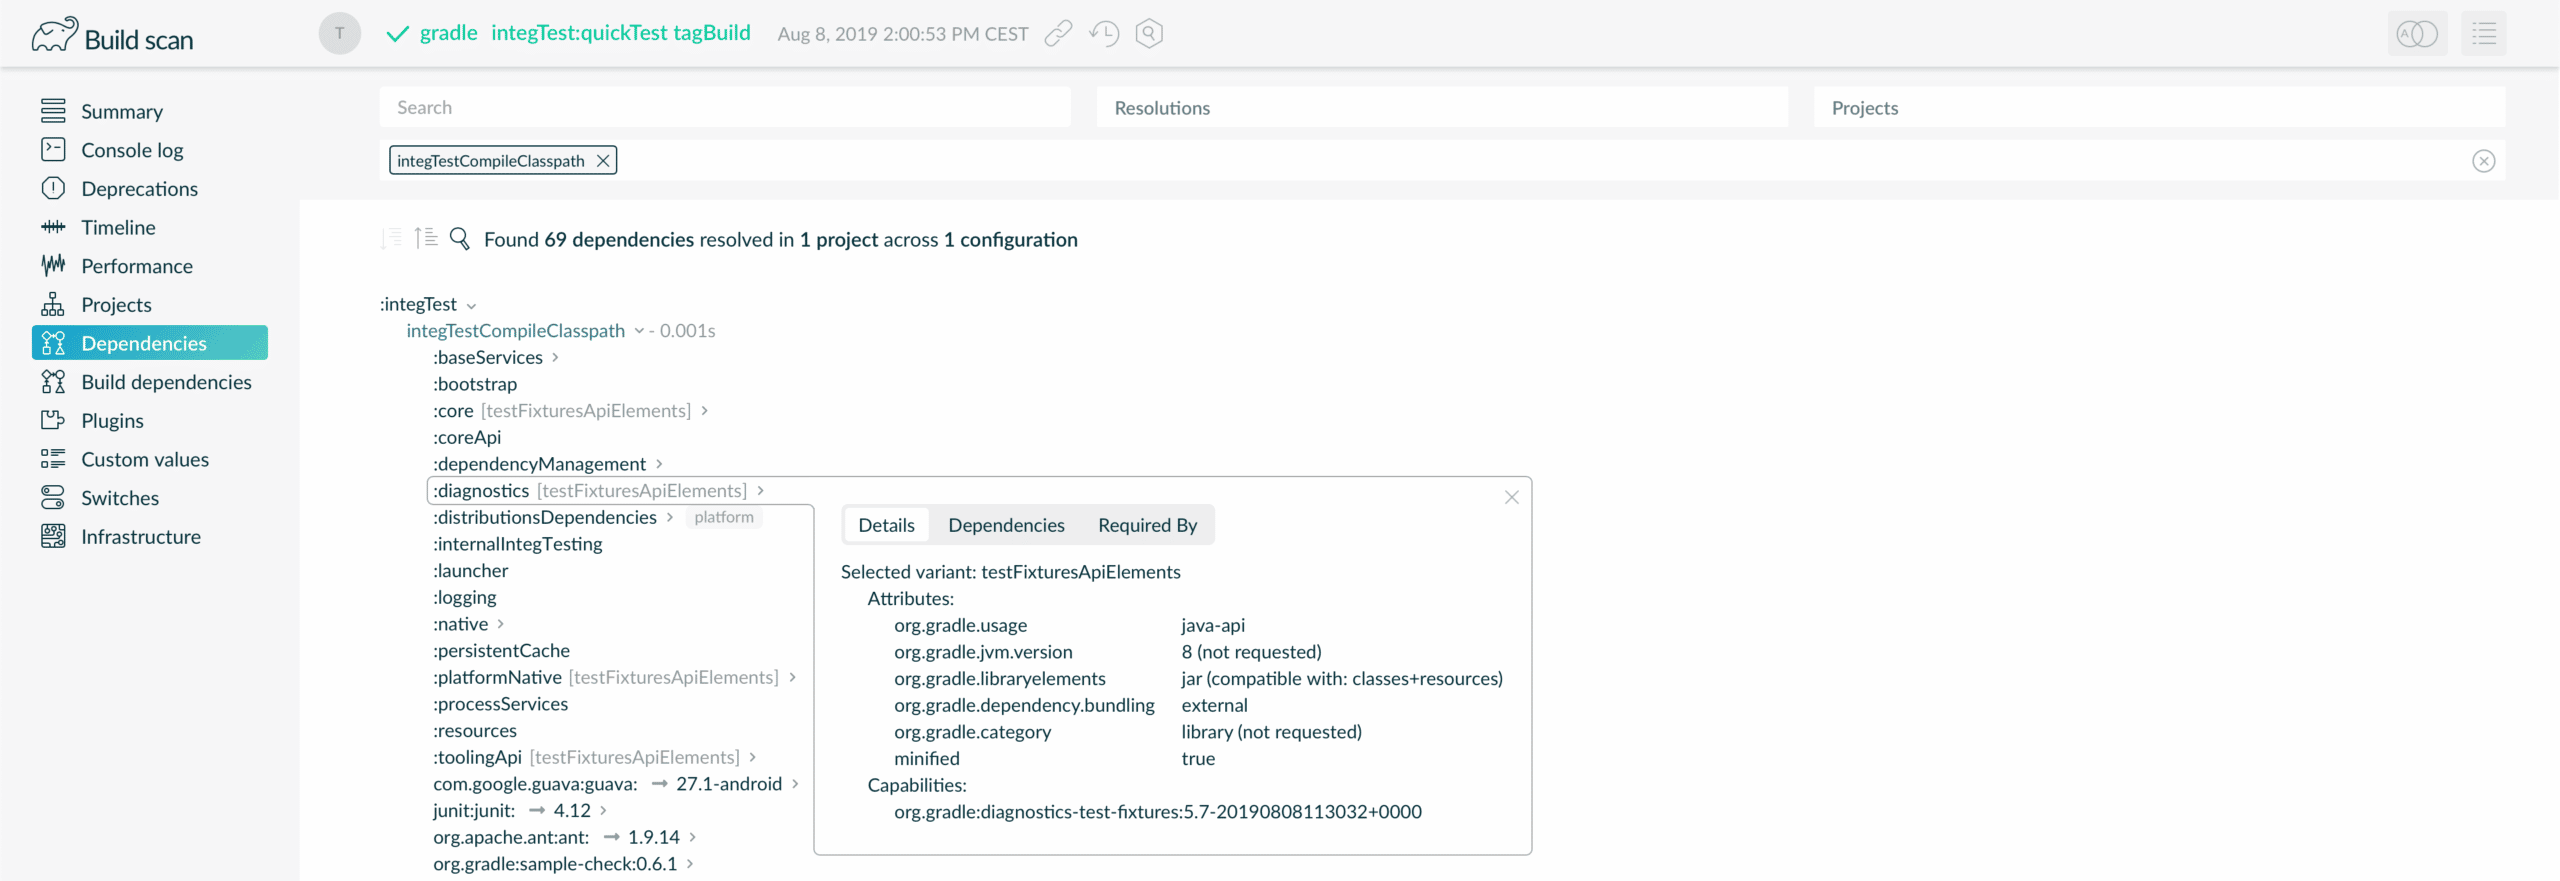
Finally, rich dependency version constraints are now displayed in the dependency details view, more usefully showing what version constraints were requested for a particular dependency.

Build logic dependencies in Gradle build scans
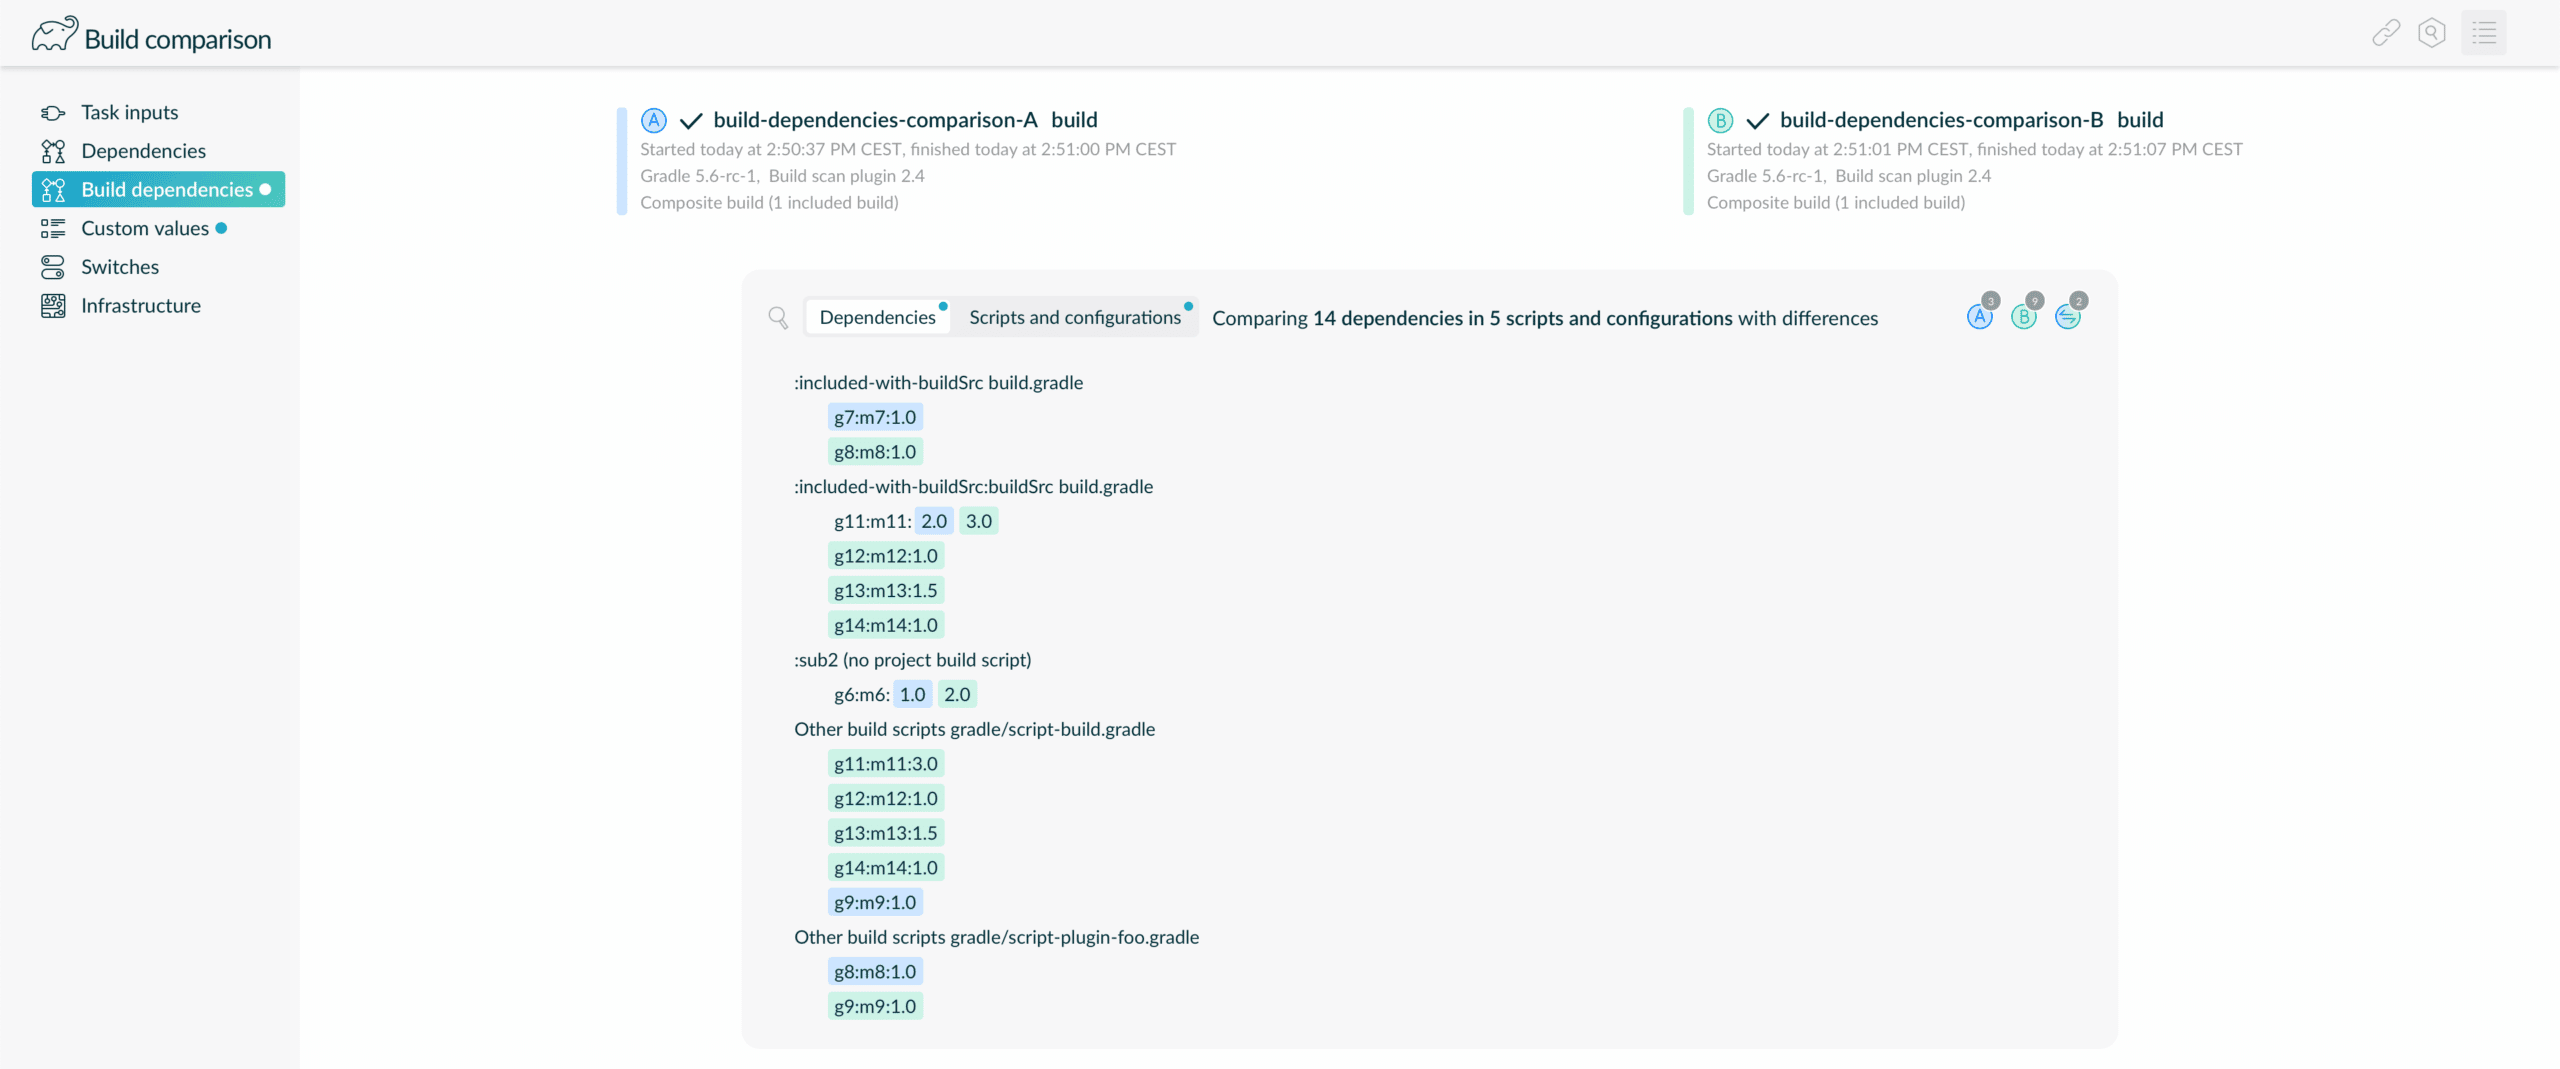
Gradle build scans now include a new Build dependencies section that visualizes the build logic dependencies. This section includes both buildSrc dependencies and classpaths for build scripts. This makes it easier to debug dependency version conflicts of Gradle plugins and other dependency issues.

Build dependencies can also be compared between builds.
Enhanced Gradle Enterprise Maven Extension Build Scan API
The Gradle Enterprise Maven Extension Build Scan API now offers the same functionality as its Gradle counterpart, allowing programmatic control over build scan publishing and other aspects.
For example, you can use the BuildScanApi.publishAlwaysIf() method to publish only if a CI system property is set or based on any other criteria.
See the Gradle Enterprise Maven Extension User Manual for details and examples of how to use the API in your own Maven plugin or extension, or with the Groovy Maven plugin.
Upgrade notes
Degraded performance due to data reindexing
Upon upgrading, a data reindexing process will be initiated in the background with Gradle Enterprise being usable for its duration. CPU usage will be increased and performance may be slightly degraded. For large installations storing many build scans, the reindexing process may take several hours.
Changes
- [FIX] Improve data cleanup performance
- [FIX] Improved performance of data cleanup during daily maintenance
- [FIX] Show problem warning if daily maintenance takes too long
- [FIX] Help panel content visible on screens of all sizes
- [FIX] Show large script URLs in build dependencies correctly
- [FIX] Gradle 6.0 compatibility with Gradle Enterprise plugin 3.0
- [FIX] Navigation between build scan functions is improved
- [FIX] Whitespace is more accurately represented for Maven console logs
- [FIX] Tasks can be grouped by cache-ability in builds that did not enable the build cache
- [FIX] Better handling of Gradle builds manually resolving dependencies at unexpected times
- [FIX] Dependency search sometimes shows incorrect results for some combinations of search criteria
- [FIX] Build scan ingestion more reliably recovers from periods of sustained heavy load
- [FIX] Custom SSL trust is used for build cache node and SMTP connections
- [FIX] Cache network health indicator no longer requires authentication to view
- [FIX] Homepage is replaced by build scans page
- [FEATURE] Untrusted certificates can be added to GE to allow communication with untrusted SMTP server
- [FEATURE] Sending Email Notifications now supports SMTP with implicit TLS
- [FEATURE] Scan list page usability is improved
- [FEATURE] Serialized event manifest size is reduced
- [FEATURE] Ingest of large payloads has performance improved and does not interfere with intake partition management
- [FEATURE] Build scan displays whether "Task inputs file capturing" is enabled
- [FEATURE] Remove public IP address from being displayed
- [FEATURE] Host level metrics are captured to the support bundle for native installations
- [FIX] Dependency details tabs are spanning multiple lines
- [FIX] Tags are not displayed correctly on Gradle summary page with a large number of tags
- [FIX] "View goal in console log" is visible when console log section is not available
- [FIX] Export API does not wait for build to be ingested when requesting events for pending build
- [FIX] Adjacent scans modal is not in front of all page elements
- [FIX] Focusing on Maven tests with same name is not possible in the by-project view (https://github.com/gradle/dotcom/issues/3715)
- [FIX] Intake batch flushing is not constrained
- [FIX] Build projection processing is not constrained
- [FIX] JS vulnerabilities
- [FIX] Database container does not wait for application containers to stop before exiting
- [FIX] Build dependencies should handle build scripts resolved from remote URL
- [FIX] Request for a build being processed should not prevent application shutdown
- [FIX] Failures dashboard projection is not deleted when a build is deleted
- [FIX] Build cache details are misaligned in timeline task inspector
- [FEATURE] All applications run on Java 11
- [FEATURE] Absolute number of build failures is shown on failure analysis page
- [FEATURE] Users understand that failure listing includes N (up to 50) of X failures
- [FEATURE] Failure Dashboard clustering debug endpoint is easier to access for custom queries
- [FIX] Dependency variants are not shown in Gradle dependencies comparison
- [FIX] Failure classification model accuracy can be improved
- [FIX] Clusters in failures dashboard do not show common elements of file paths
- [FIX] Built-in cache node does not report the correct version
- [FIX] Build cache controller does not handle identical nodes due to automation
- [FIX] Failed build cache stores leave files in upload directory
- [FIX] Failures dashboard fails given null error message from Maven
- [FIX] Failures dashboard groups forked process with different exit code values
- [FIX] Failures dashboard does not group failures with empty message correctly
- [FIX] Task duration breakdown tooltips should not be displayed
- [FIX] Failure dashboard projection is dependent on event order
- [FIX] Build dependencies section does not show all build dependencies
- [FIX] Dependency Summary counts in summary and details view are not shown correctly
- [FIX] Required by section in build dependencies does not show unspecified module for build scripts
- [FEATURE] Build failure analysis
- [FEATURE] Test results for Maven builds in build scans
- [FEATURE] Console logging for Maven builds in build scans
- [FEATURE] Workspace build history for Maven builds
- [FEATURE] Dependency download time visualization
- [FEATURE] More fine-grained Gradle task duration breakdown in build scans
- [FEATURE] Enhanced Gradle dependency insights
- [FEATURE] Build logic dependencies in Gradle build scans
- [FEATURE] Enhanced Gradle Enterprise Maven Extension Build Scan API

 DPE University