Have you ever had an infrastructure failure break your build, or perhaps been forced to stop working in order to fix broken build configuration?
Changes to development infrastructure often happen unbeknownst to the engineers it serves. Many problems go unreported, but chip away at our productivity much more than we realize.
It is important to identify and stop non-verification failures (those not caused by routine development, such as compile and test failures) before they disrupt your organization.
To combat this, we are pleased to introduce new failure analysis tools in Develocity 2019.3.
The top failures report shows the most frequent Gradle and Maven build failures, grouped by cause and charted over time. Selecting a failure initiates a search for all occurrences of that failure; along with breakdowns by day, user, build hostname, and common tags. You can search failures by their message to quickly see when and where they’re happening.
Identifying and resolving disruptive build failures
I’m going to show you how we identified a nasty build problem in Gradle’s own build to demonstrate this feature.
I want to identify and eliminate failures that affect local development because we know they hurt Gradle engineers directly.
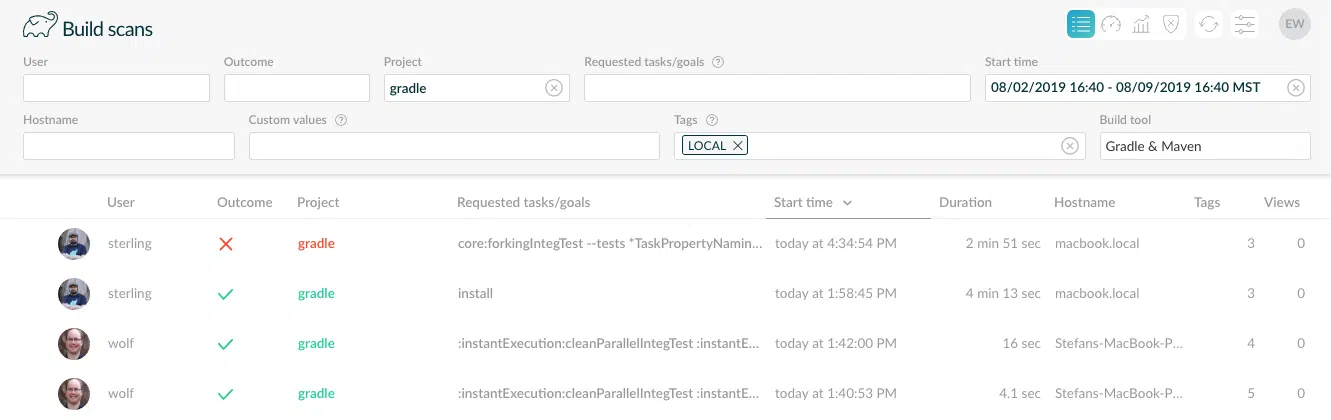
From the scans list, I first filter builds for the gradle project having the LOCAL tag.
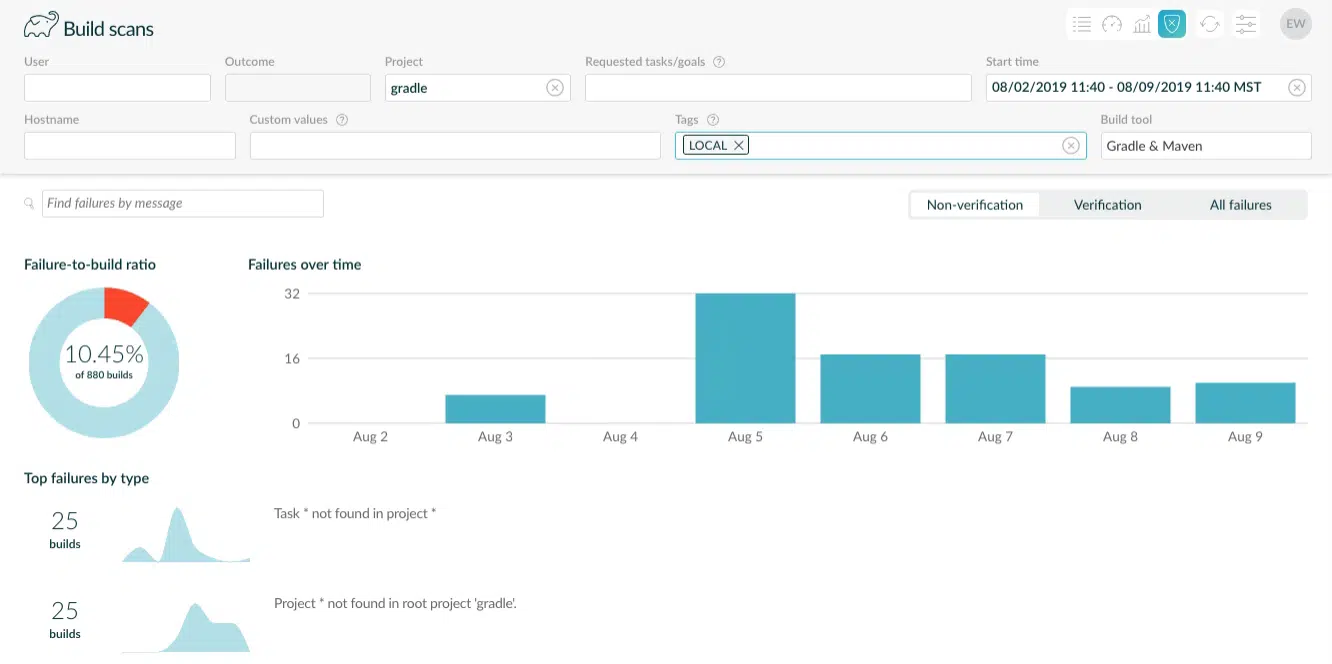
Then I click the Failures Dashboard button ![]() to see the most frequent Gradle and Maven build failures grouped by cause and charted over time. By default, only non-verification failures are displayed.
to see the most frequent Gradle and Maven build failures grouped by cause and charted over time. By default, only non-verification failures are displayed.
To achieve this, Develocity performs semantic analysis of failures to classify non-verification failures. Then, the failures are clustered by similarity, and the exclusive phrases for each cluster are extracted to form a fuzzy matching pattern that uniquely matches all failures in the group.
Most of the time test and lint failures aren’t interesting, but verification failures or all failures can be analyzed via the classification toggle.
![]()
Selecting “All failures” provides far more failures, and unsurprisingly, shows test failures as the most commonly occurring build failure.
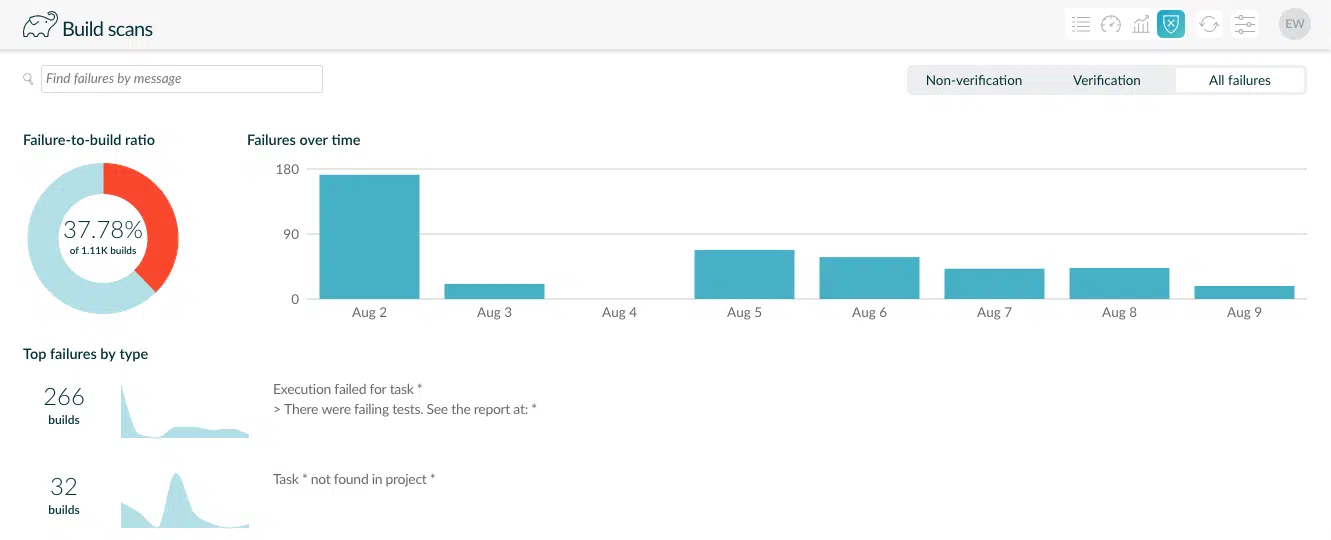
Project * not found in root project ‘gradle’ is an unexpected non-verification failure type from before so we investigate it.
Breaking down build failure patterns
We click on the failure type Project * not found in root project ‘gradle’ to see where and how often this is happening.
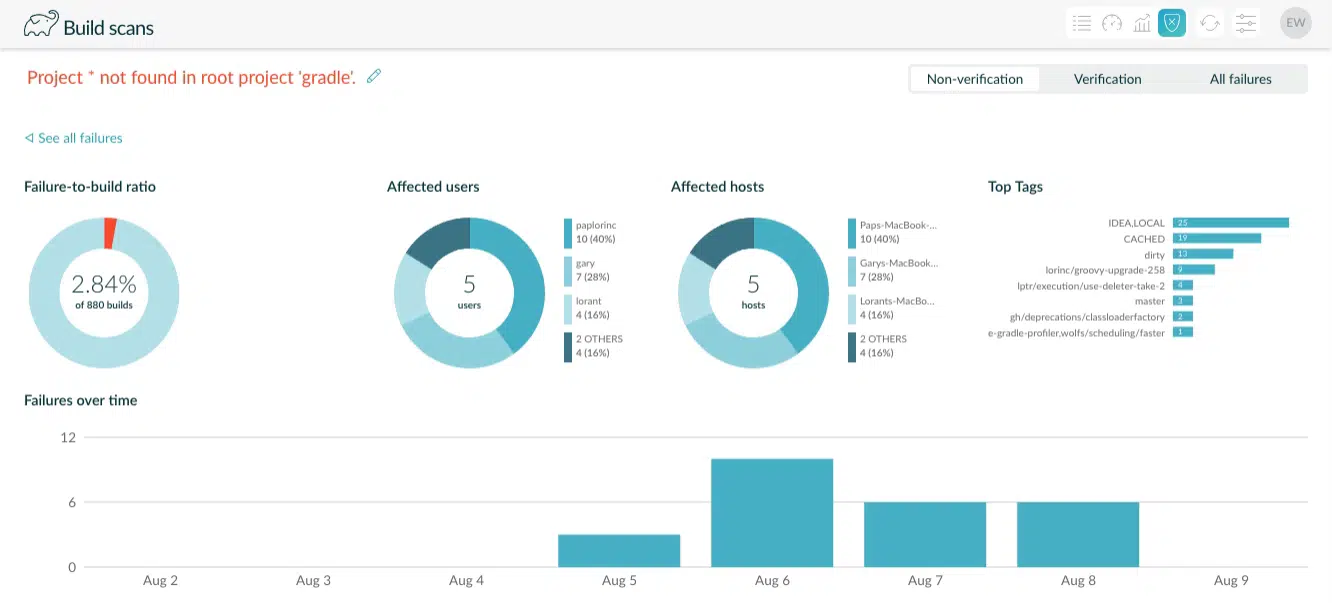
We see that 1 out of every 40 builds fails with this type of error, which is quite frequent. Worse, it has affected half of the team.
We expand the time period to see how long this has been happening.
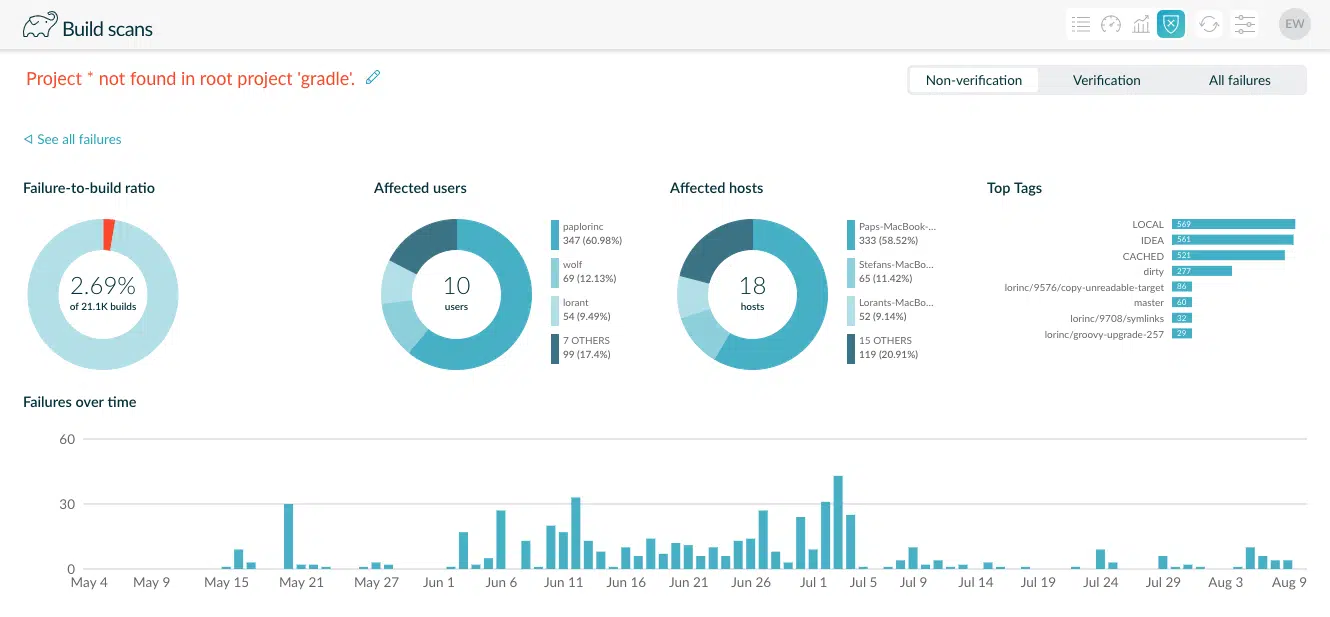
It looks like it started really happening in early May.
It’s intriguing to see the IDEA tag is one of the top-most tags. For context: Gradle engineers develop and test changes using IntelliJ IDEA, and we tag builds run by IntelliJ with IDEA.
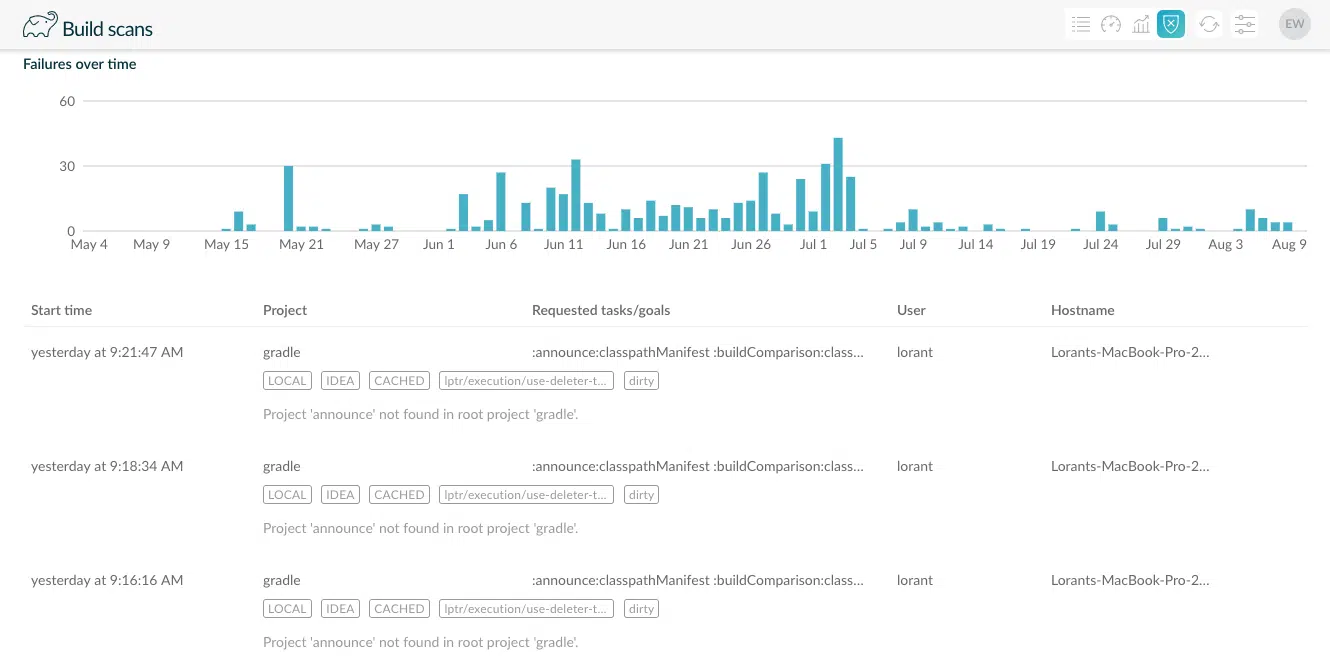
The bottom of the page lists the 50 most recent occurrences of this failure and their details. We can click on a build to go to the corresponding build scan.
Scrolling through the list, I see from the image above that all most recent failures affect the “announce” subproject. I refine the failure message search to Project ‘announce’ not found …
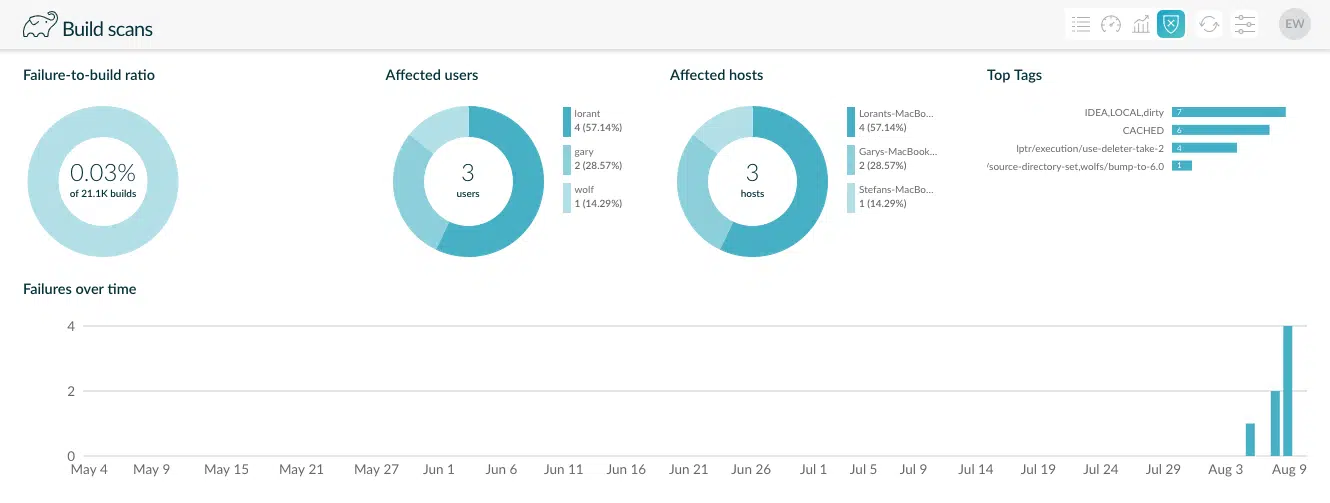
Aha! This problem was introduced very recently. I now know that a recent change caused this to start happening, and sure enough, this commit did not remove all of the cases where the “announce” subproject is being referenced, which affected IntelliJ sync.
“Is anyone else getting this error?”
One of the most interesting parts of this new feature is failure search.
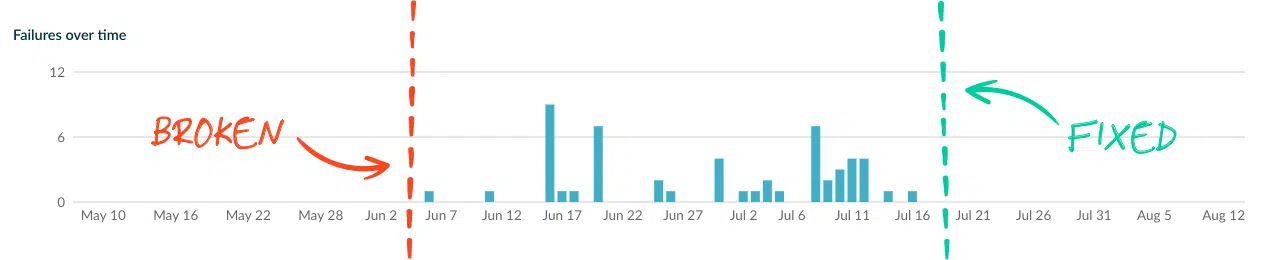
The first thing you want to know when encountering an unexpected build failure is if the problem is localized to your environment or not. That’s why we designed failure search to allow copy-paste of error messages directly from your command-line or CI logs.

You now instantly have data to confirm the severity of the issue, and can prove when it’s fixed!
Here are some other useful things to try with failure search:
*:yourProject:yourCustomTask*— failures involving a specific task* Could not resolve * https://repo.yourcompany.com*— dependency repository failures* > Process 'command *node*— specific forked process failures* > A problem occurred configuring *— any Gradle configuration failure
You don’t optimize what you don’t measure
We hope that this feature will bring a new lens to look at your developer productivity, and we are eager to hear your thoughts on this new failures dashboard.
If you’re not already using Develocity, request a trial if you’d like to give this and other analytics a spin.
Stay tuned to read about the other big things we will ship soon.