Introduction
 In the world of software deployment, three things are certain: death, taxes, and build tool migrations. Whether it’s upgrading from Gradle 7 to 8, or moving from Maven to Gradle or back, these migrations are both essential and complex. The success of planning, implementation, and post-migration management is heavily dependent upon the quality and presentation of toolchain data available to teams before, during, and after the migration. Develocity provides a wealth of mechanisms and dashboards—as well as an Enterprise API—for collecting and presenting data essential to successful build tool migration efforts.
Develocity’s performance optimization and continuity greatly accelerates build and test cycles. Faster builds mean engineers get feedback rapidly, making the configuration and code refactoring process—often required during migration or upgrade efforts—much more efficient. But speed is only one efficiency improvement offered by Develocity. The insights gathered and presented by the Develocity Build Scan® capability provide even greater benefits and help ensure success through every phase.
Let’s dive deep into the value of the Develocity Build Scan and Failure Analytics data in efficiently achieving successful build system migrations.
Migration Tracking: The Build Scan® List View
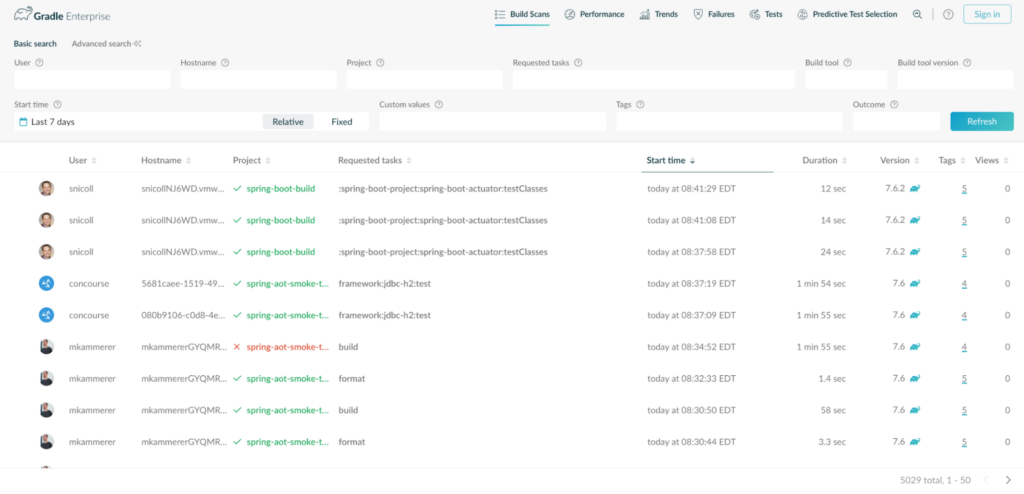
Central to monitoring migration progress is the Build Scan List View. Generally, every time a build finishes, it pushes a large amount of forensic data about that build to Develocity, which is processed and presented as a Build Scan.
The Build Scan List View lists each Build Scan, essentially presenting a comprehensive dashboard of all builds that have taken place over a specific period of time:
Build Tool and Version Tracking
Each scan showcases the build system and version that was used for that build. This is presented alongside the build project name and the user that initiated the build. As teams execute on their build system migration plans, this information is vital for understanding whether every module or project is transitioning as intended.
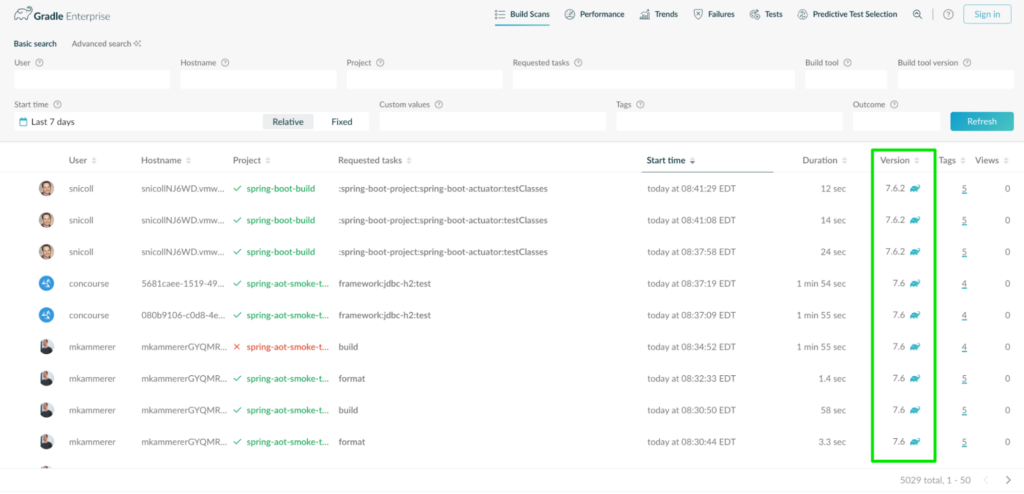
It’s clear and intuitive to determine from this view which builds have undergone a migration and which ones have not:

Searching and Filtering of Builds
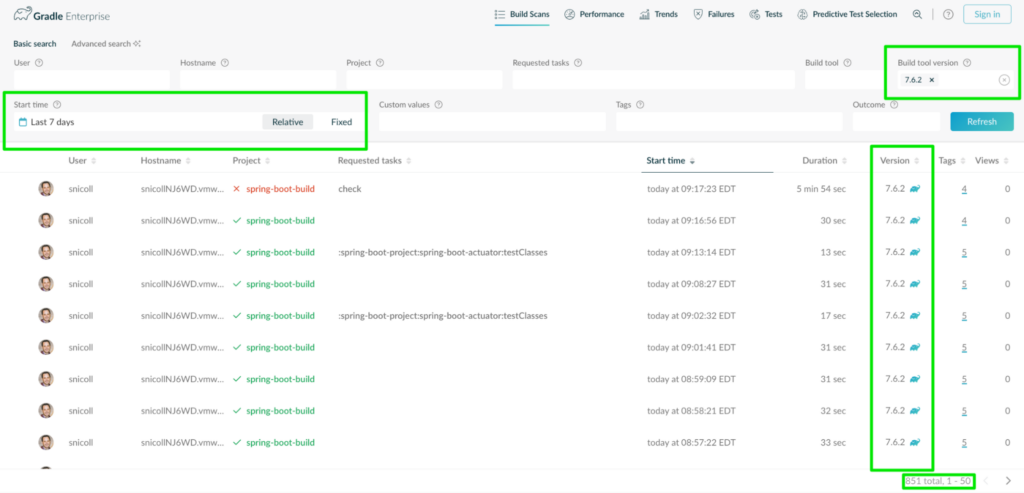
Search capabilities allow you to zero in on specific build systems and build system versions. This can help you visualize a set of builds based on whether or not they have successfully migrated. Doing so provides a flexible means of representing the migration’s surface area, making it easy to understand how much progress is being made and how close the effort is to completion.
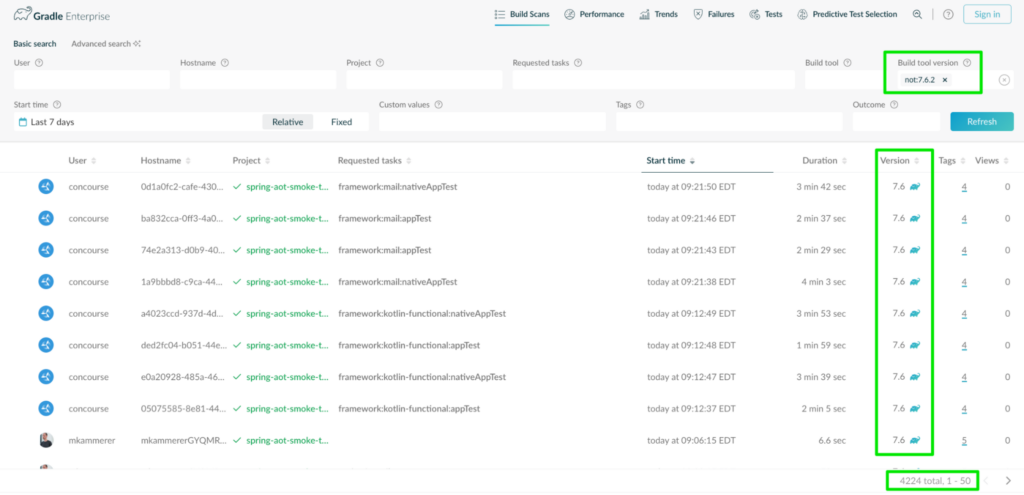
Suppose a team is upgrading from Gradle 7.6 to 7.6.2. It’s going to be necessary to determine how many builds of a certain project have completed their migration. The “Build tool version” search filter can be used to see which projects have moved to the newer 7.6.2 version of Gradle, and how many builds over a period of time, configurable via the “Start Time” filter, have been completed using that version:
Conversely, if you want to see which projects have not yet migrated to a newer target version, you can use a negative search against the target version:
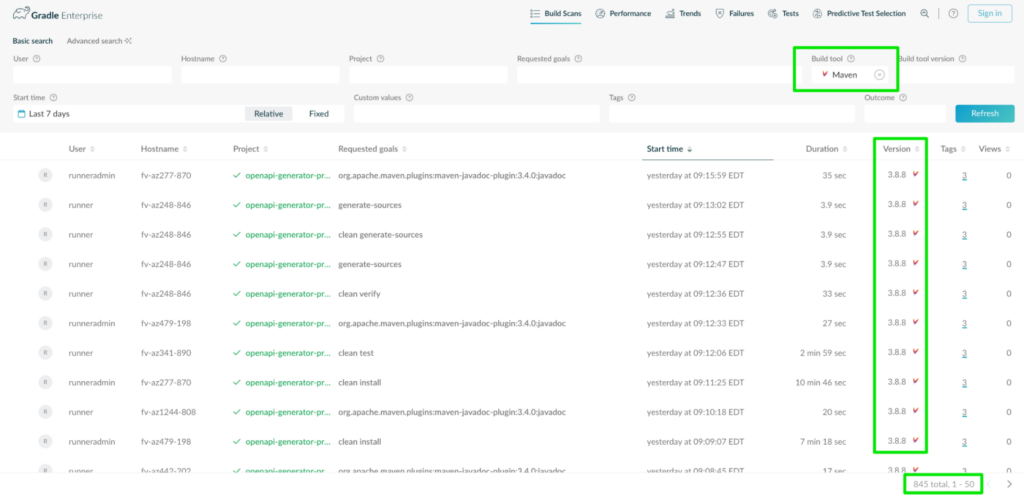
Or, if a team is migrating from one build system to another, teams can easily track and isolate builds matching a specific build tool to monitor the progress of the migration:
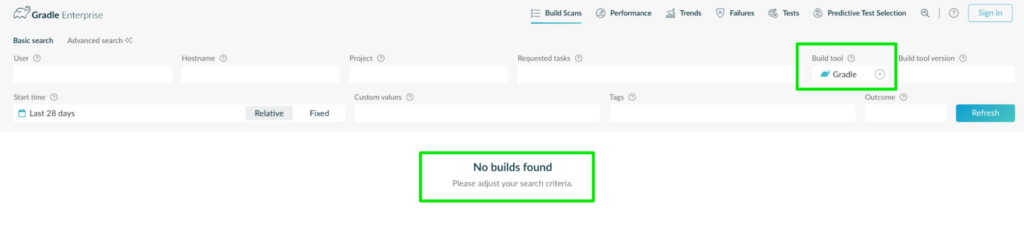
It can also be used to ensure that no module is left behind. For instance, if said team is migrating from Gradle to Maven, that team could isolate Gradle builds to ensure none are left behind and validate that the migration has indeed completed:
Collaborative Migration Troubleshooting with Build Scan
Build Scan is both a self-service tool for the individual developer as well as a collaborative tool for troubleshooting between multiple engineers or engineering teams. Build system upgrades and migrations tend to be cross-functional efforts, especially in larger development organizations. When teams want to communicate details about a certain build, or when they have to troubleshoot unexpected behavior across multiple teams, there are often challenges in packaging and communicating details about the build in ways that don’t introduce more friction.
For instance, calling out a specific dependency in a build and the context surrounding that dependency is often a painful process that involves running multiple console commands, copying and pasting text, and taking screenshots. Even doing something as simple as pasting a snippet from a console log to a colleague is often received without full context, which just triggers a round of questions.
Almost every data point in a Build Scan can be deep-linked and shared with colleagues. In the left margin of the Build Scan interface, a link icon will appear when hovered over:
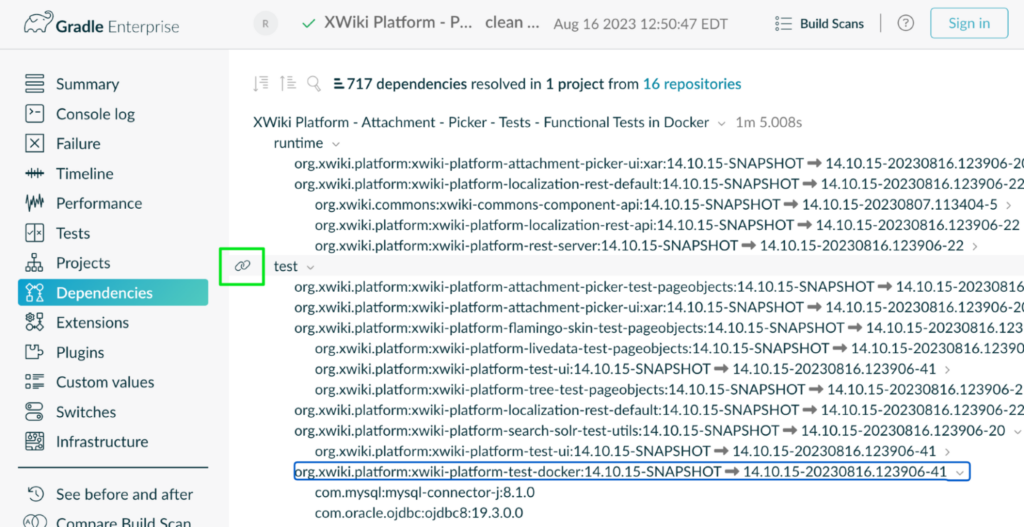
That icon can be clicked to create a custom link in the browser URL window. That link can then be copied and sent to a colleague. When the deep link is opened, it will direct the user straight to the same point in the Build Scan. Moreover, the user will have full access to the rest of the Build Scan, so any questions about context, or any other data, can be gathered self-service without a lot of expensive interaction.
Managing Dependencies and Plugins During a Migration
Some build systems or build system versions might resolve dependency and plugin versions differently. For instance, if two libraries depend on different versions of a third library, the build system decides which version to use, and different systems might make different decisions in such scenarios. Additionally, build systems may handle transitive dependencies in different ways, including how they resolve dependency conflicts or whether they include them at all. There are even cases when a certain dependency is simply incompatible with the build tool, such as dependencies with obscure initialization processes.
Develocity Build Scan provides four data views that specifically address these challenges: the Dependencies pane, the Deprecations pane, the Build Dependencies pane, and the Plugins pane.
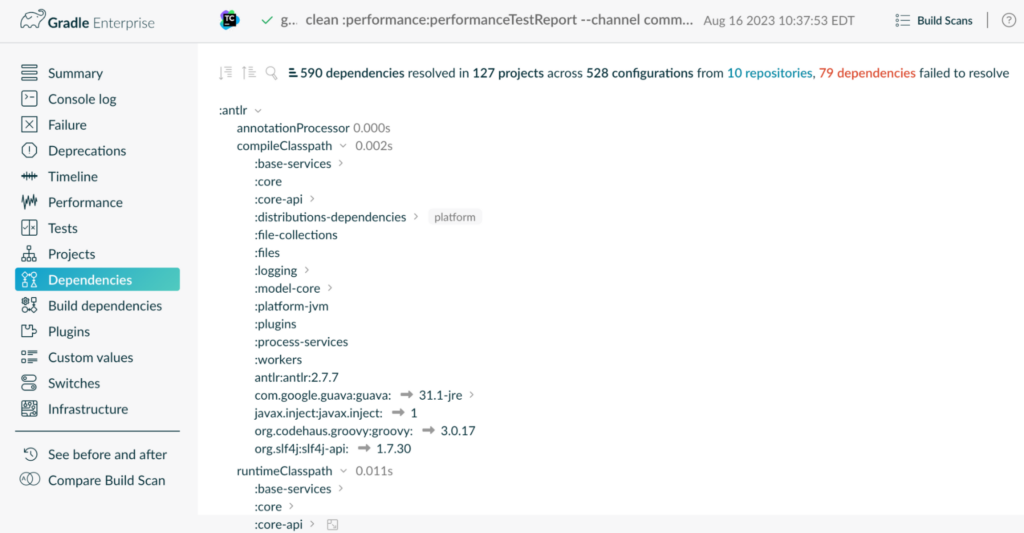
Build Scan: Dependencies Pane
Migrations are impacted by the complexity of a project’s dependency configuration. Develocity helps to alleviate this by providing deep insights into a build’s dependency configuration and resolution. The Build Scan “Dependencies” pane provides a comprehensive overview of every dependency associated with a build. This view is helpful across each phase of a build system upgrade or migration.
- In the planning phase, success depends on understanding which dependencies are currently being utilized by the project.
- During the implementation, there will be many build failures, and this pane can expedite troubleshooting of dependency-related failures.
- Post-migration or post-upgrade, it will be important that the dependencies selected are consistent with the original application configuration before the change.
Beyond understanding which dependencies are selected, it’s often valuable to understand why the build system may have made certain decisions or changes to the intended dependency configuration, whether to obey rules, resolve conflicts, or any of the other reasons why chosen dependencies often differ from requested ones. Build Scan allows users to filter by the dependency resolution outcome, and provides details on why a choice might have deviated from the requested version:
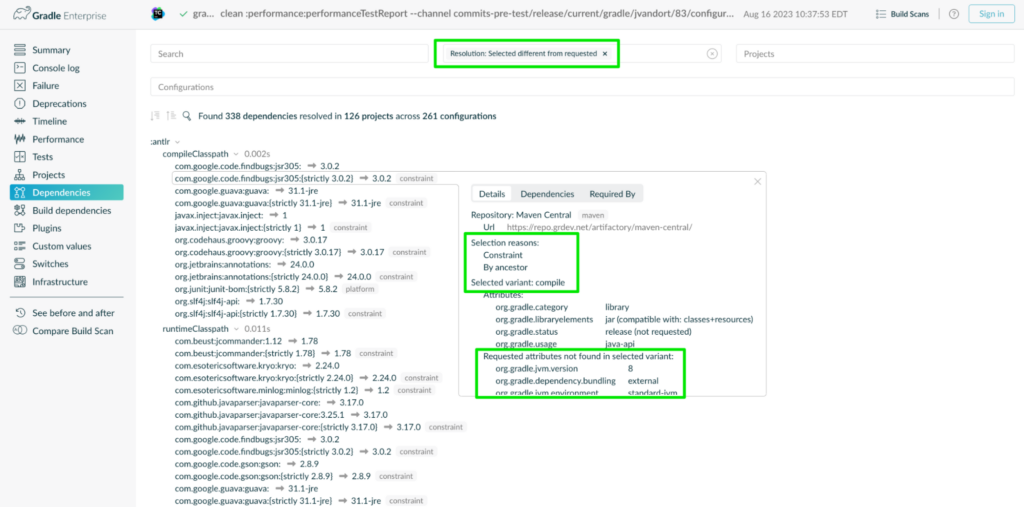
This view can help pinpoint unexpected behaviors or problems that arise during or after the migration. Without Develocity, troubleshooting these types of problems involves a painful reverse engineering of dependency declaration and resolution behavior, wasting hours of invaluable engineering time.
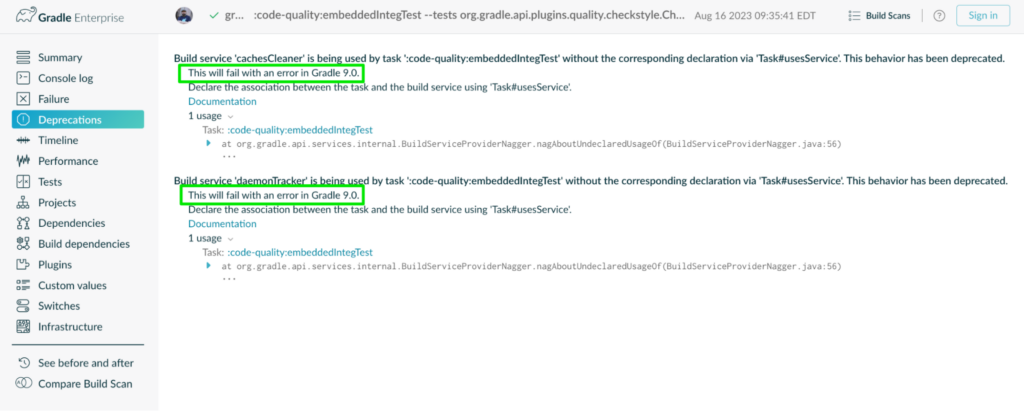
Informed Upgrading: The Deprecations Pane
The Deprecations pane functions like a forward-looking advisory report for build tool major version upgrade initiatives, signaling deprecated features in the current build system version and linking to the documentation that explains the deprecation. Before upgrading, you can spot which parts of your build might break in the newer version because they use deprecated features.
Teams can use the Deprecations pane during the planning phase of a build system upgrade, to understand what sort of refactor will be necessary pre-implementation to ensure that the project is 100% ready for the next major version of the build tool.
By providing a clear and concise view of every deprecation present in the current build, teams can construct a roadmap for refactoring their project. As those refactors are completed, teams can continue to run the Build Scan service until the number of deprecations in the build reaches zero, indicating that the project should be API-compatible with the next major version of the build system.
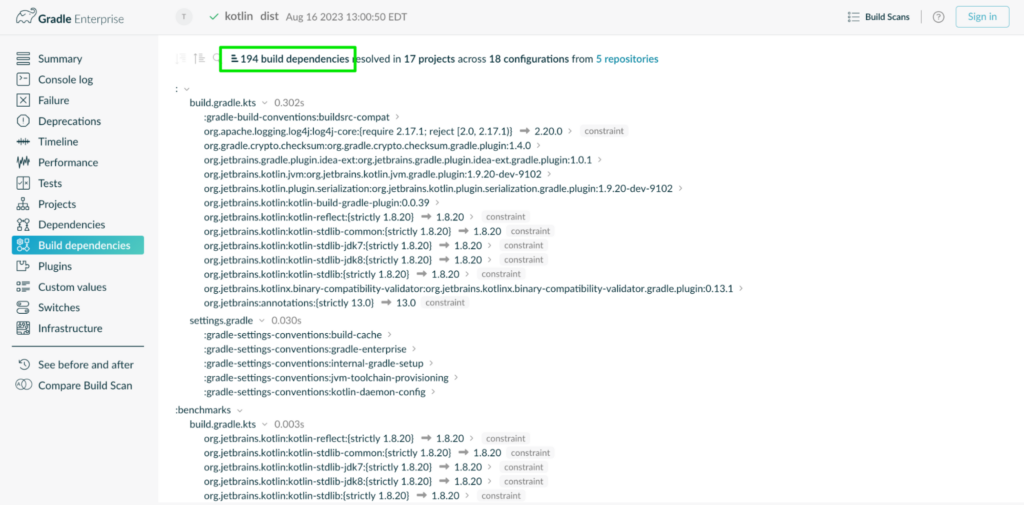
The Build Dependencies Pane
While projects will have their own set of software dependencies, oftentimes the build system itself will depend on its own set of external libraries to complete its work. The Build Dependencies pane in Develocity provides a detailed and searchable interface for build dependencies:
Similar to the Dependencies pane, build dependencies can be filtered, and a justification for their selection is provided:
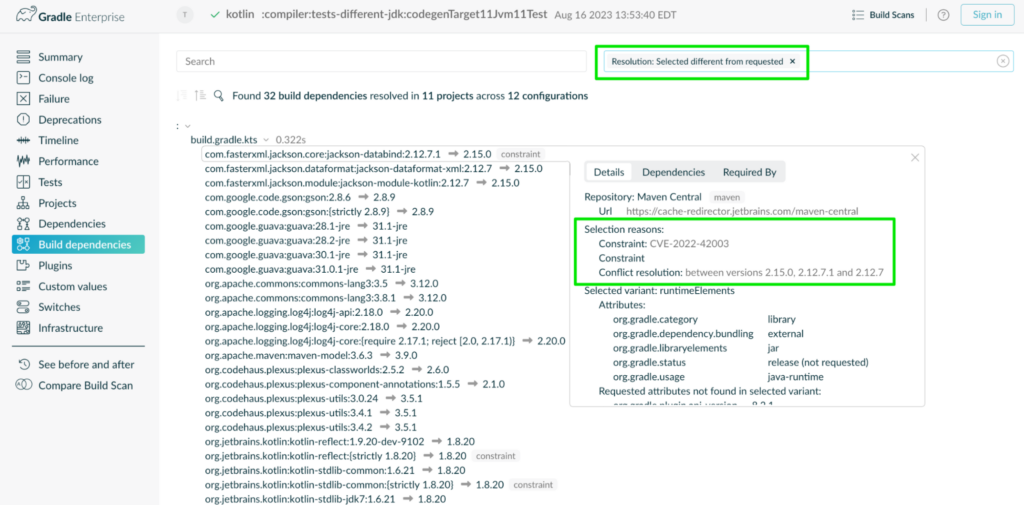
Just like any other software dependency, build dependencies may be aligned to specific versions of the build system, and they may change as the result of an upgrade. Having a simple interface to view build dependencies and their selection context can significantly improve troubleshooting times when they are responsible for changes in behavior during an upgrade.
Deciphering New Failures & Test Flakiness During and After Migration
A build system upgrade is an invasive change, and a build system migration is invasive to an extreme. In complex projects and build environments, these kinds of changes are likely to disrupt build processes and change test behavior. In practice, this means teams will encounter new build and test failures and novel test flakiness.
It’s important to put mechanisms in place for early detection and remediation of these inevitable anomalies. This is where Build Failure Analytics and Test Failure Analytics offer invaluable insights.
Measuring Failure Impact with Build & Test Failure Analytics
Whenever a Build Scan detects a failure in a build, details about that failure are aggregated and analyzed by Develocity. Develocity then arranges build failure data over a period of time. Because all of this failure data is filterable and searchable, Develocity makes it easy to spot new failures or increased failure rates from a wide cross-project view down to a granular per-task resolution view.
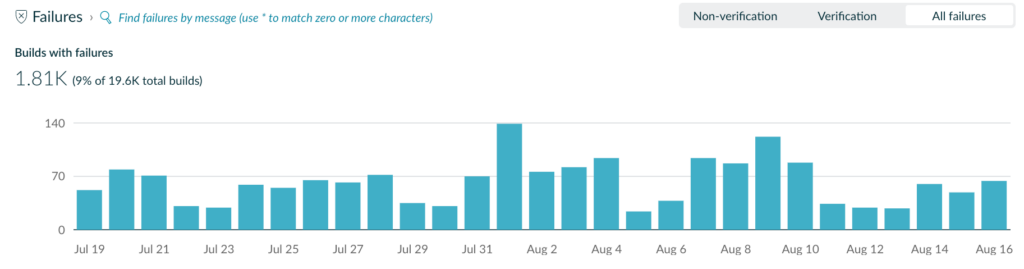
Large migrations are in many cases broken down into multiple remediation phases, and understanding which failures impact the most developers is vital in ensuring that the best decisions are made. By analyzing failure data, Develocity can report on the most impactful build failures. The top failures across a filterable set of Build Scan records are presented in the Build Failure Analytics interface. Teams can then use this data to prioritize remediation efforts during the migration process.
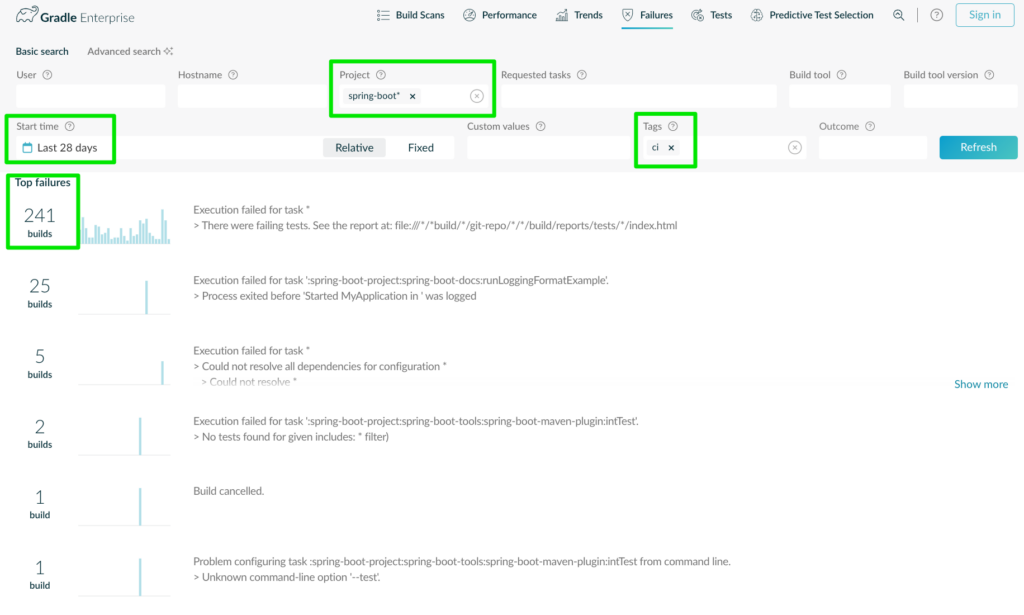
Users can drill down further and receive detailed analytics about any single failure. The top failure in this example has impacted 241 CI builds in the Spring Boot project over the specified time period of 28 days. Develocity allows users to drill down even farther into the details and history of a single failure. By clicking the top example, users are presented with a granular view of the failure with links to an individual Build Scan related to each build failure.
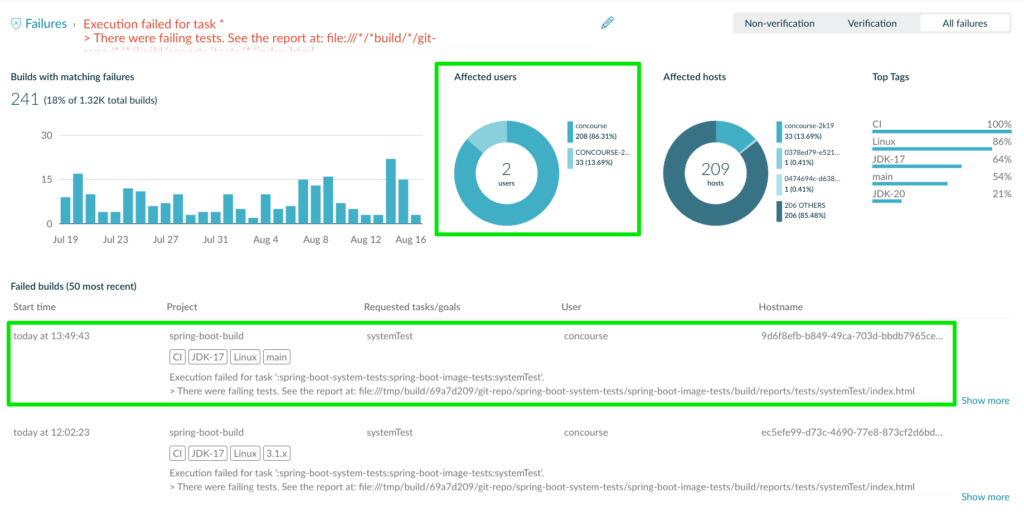
By taking advantage of this data and related analytics, organizations undergoing build system upgrades or migrations can understand where failures are introduced across the full build environment. Disruption is unavoidable in efforts like these, and Failure Analytics can greatly reduce the impact of that disruption and ensure the smoothest migration possible.
Detecting Unexpected Test Behavior with Test Failure Analytics
Test sets are also likely to be impacted by build system migrations or upgrades. This can take the form of new test failures, or even the introduction of additional test non-determinism or flakiness. This is because tests may have been written against a certain set of assumptions about things like dependency versions and build system capabilities.
In any case, it will be important to detect any novel unexpected test behavior and remediate it accordingly, perhaps in the form of additional flaky test days during and shortly after the upgrade or migration period.
Develocity Test Failure Analytics aggregates and displays failed tests over time much in the same way as it does for build failures above:
However, it can also detect non-determinism and report on when that flakiness was introduced to the test set. And therefore, whether that flakiness may have been introduced as the result of an upgrade or migration.
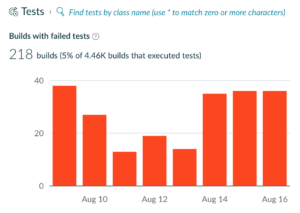
First, Test Failure Analytics will display test flakiness over time:

Then, builds can be sorted by either failure rate or flakiness rate over time, so that, much like Build Failure Analytics, hard data can be used to determine prioritization of remediation during and after the upgrade or migration.
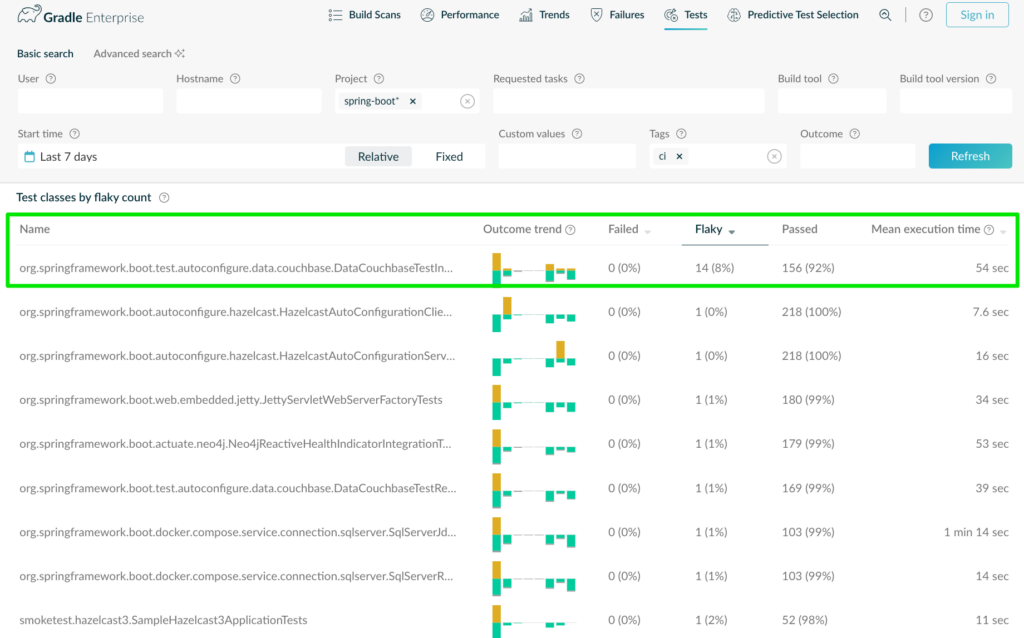
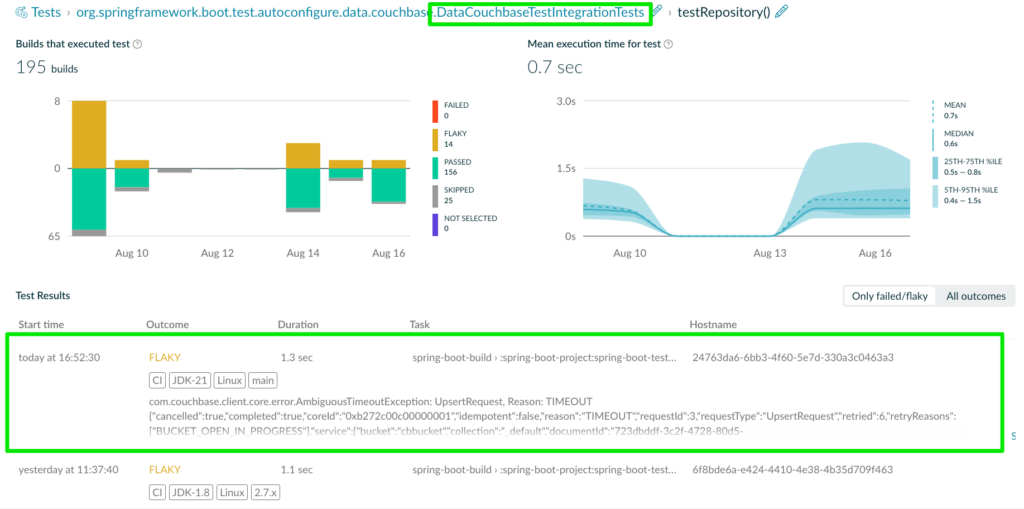
This interface points out the “flakiest” test, and we can then drill down further to see the behavior of that individual test over time, as well as link to each Build Scan related to the failure or flakiness.
Conclusion and Next Steps
Build system upgrades and migrations can be daunting, but with the right tools and data in hand, they can be successfully orchestrated with minimal impact on operations. Develocity ensures clarity, efficiency, and collaboration from planning to post-implementation by providing relevant data and insights at every step.
If you want to learn more, these resources will point you in the right direction:
- Build Scan Essentials Bite-Sized Videos – Learn about each section of the Build Scan and how it can help you collaboratively troubleshoot your builds.
- Enterprise API OpenAPI/Swagger Docs – See how migration details can be extracted from Develocity into your own dashboard.