![]()
This summer the Gradle team provisioned a Develocity instance for the Micrometer open-source project and helped us a lot in optimizing our Micrometer build.
Micrometer’s build has been enjoying the advantages of the Gradle Build Tool since the inception of the project. Introducing Develocity has led to a significant number of improvements to the team’s developer productivity.
Troubleshooting Build Issues
At the end of every build the Develocity plugin publishes a Build Scan™, which is a record of the whole build that contains many details. You can see several examples on Micrometer’s Develocity instance. We highly encourage you to look into these since they provide meaningful insights into what happened and why in a particular build. Here are some examples:
- What Java version did you use?
- On what OS?
- Which branch/commit did you build and when?
- What was the error message?
- Which task failed?
- Has anyone else had this problem before?
- Has anyone ever successfully built this commit?
This helps us considerably when we need to troubleshoot issues. And since the Micrometer team is very distributed with big time differences, a Build Scan makes it possible to do many things asynchronously. This includes interacting more efficiently with other teams or our users since there is no more unnecessary back-and-forth when discussing and investigating build issues.
A Build Scan is not just shareable and searchable, but also comparable. You can try this out on Micrometer’s Develocity instance. This can be handy not just for troubleshooting but for build optimizations too.
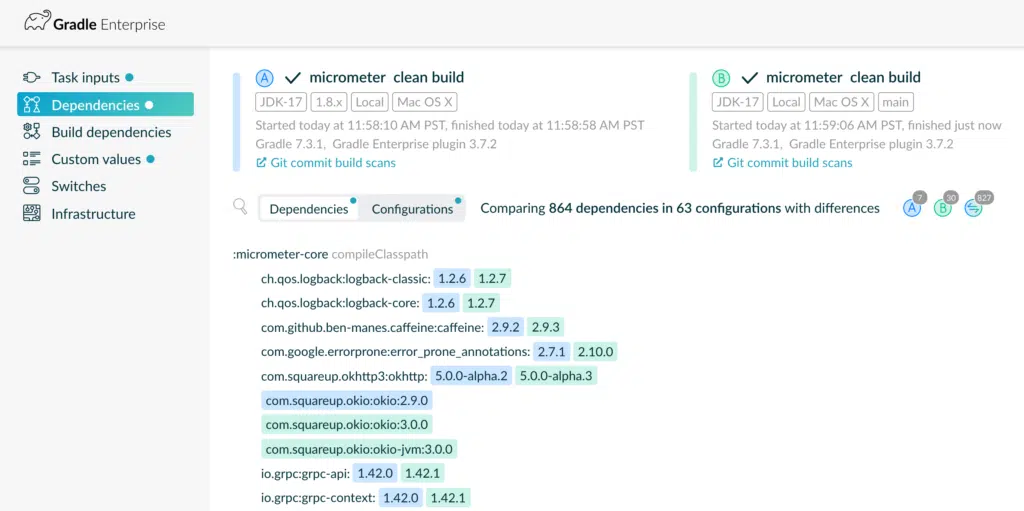
A build scan comparison between two builds showing unexpected differences to maven dependency versions causing cache misses.
Optimizing our Builds
The Gradle team was really kind and provided us with a bunch of guidance during our journey, including a great written guide with prepared experiments that helped us to incrementally optimize our build, mainly by looking at and comparing Build Scans.
During this process we enabled the build cache, improved our build time (from 2-3 to under 1 minute), identified and fixed inefficiencies in our build, identified and fixed flaky tests, and also discovered several issues with third-party plugins that we use. The Gradle team went above-and-beyond and even opened PRs for these plugins to fix the issues.
We saw a big improvement in our build times after we enabled and optimized for the build cache. This feature stores the inputs/outputs of the build tasks and lets the build fetch and reuse the results from previous builds. This means that if the build process detects that a task has already run previously with exactly the same inputs, it will not rerun that task but instead fetch and reuse the task’s output stored in the build cache.
There is both a remote and a local build cache. When running builds locally on our laptops we can reuse build cache entries stored in the remote build cache that were previously created by the CI server. We can also reuse build cache entries created by previous builds that had run on the same local machine. This results in significantly lower build times, both when building locally and when building on CI. For example, I ran ./gradlew clean build a few times today and my build times were as following:
- No entries available in the local or remote build cache: ~2 minutes
- Entries available in the remote build cache only: ~40 seconds
- Entries available in the local and remote build cache: 5 seconds (nothing changed so there was nothing to do)
Of course, if I change something (let’s say I change the code), that part needs to be rebuilt, but Gradle rebuilds only those parts that are affected by the changes and saves the expenses of rebuilding those pieces that do not need to be rebuilt. This is very beneficial to Micrometer since we have 30+ subprojects. Not rebuilding those all the time gives us a much better development flow.
Observable Builds
Develocity also lets you look into the context of your builds and analyze/identify trends. If you look at the Performance and the Trends dashboards on Micrometer’s Develocity instance, you will be able to look back in time, filter builds, and visualize metrics about our builds which can help keep your build healthy or look at the context/surroundings of individual builds.
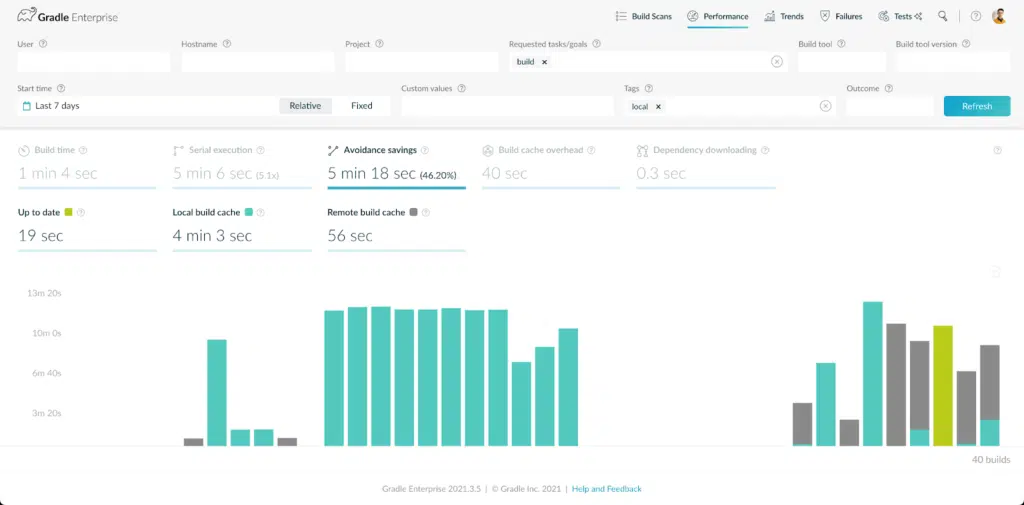
The Develocity performance dashboard shows the avoidance savings and remote build cache benefit of all builds.
Conclusion
We are very pleased with all the features and added value of Develocity and with all the improvements we were able to make with the help of the Gradle team.
We would like to take this opportunity to say a big thank you to the Gradle team for all their help and for generously providing a Develocity license for our open source projects.
We would also like to thank the maintainers of all the plugins we use. These projects help us a lot during the development and publishing of Micrometer.