As you would expect, the Develocity engineering team uses Develocity as the keystone of our development process. We recently had a build cache node crash that was impacting build times. In this post, we’ll go through the information Develocity generated before, during, and after the build cache node crash that made it easy to determine this was the cause of the slow build performance problem.
Develocity’s remote build cache
A build cache lets developers reuse the results of previous builds. The local cache in the Gradle Build Tool enables you to avoid rebuilding anything that hasn’t changed since the last build on your local machine.
In contrast, a remote build cache is shared across the entire team, letting you avoid rebuilding anything that hasn’t changed since it was built and stored in the remote cache. Best of all, the remote build cache works for local builds and CI builds. That improves the performance of every build. The remote build cache in Develocity supports both Gradle and Maven builds.
A CI build is run in our environment after each commit to the main or release branch. Only CI builds can write to the remote build cache, with future CI or local builds using whatever is in the cache whenever possible.
It’s important to keep in mind that saving information about all of your builds is vital, whether they’re local builds or CI builds. We encourage you to do what we do. Create a Develocity Build Scan™—which is like an X-ray of your build—for every build.
Investigating a build cache node crash with Develocity
Develocity gives us great insight into what’s going on with build times, including cache hits and misses. Develocity Trends & Insights consists of two feature-rich dashboards: Performance and Trends. They both provide information on current and past performance.
The performance dashboard
What does a build cache node crash look like in Develocity? We’ll start with a look at the performance dashboard:

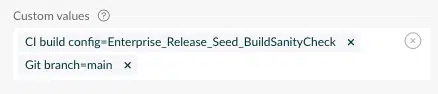
We used these custom values to filter our search:
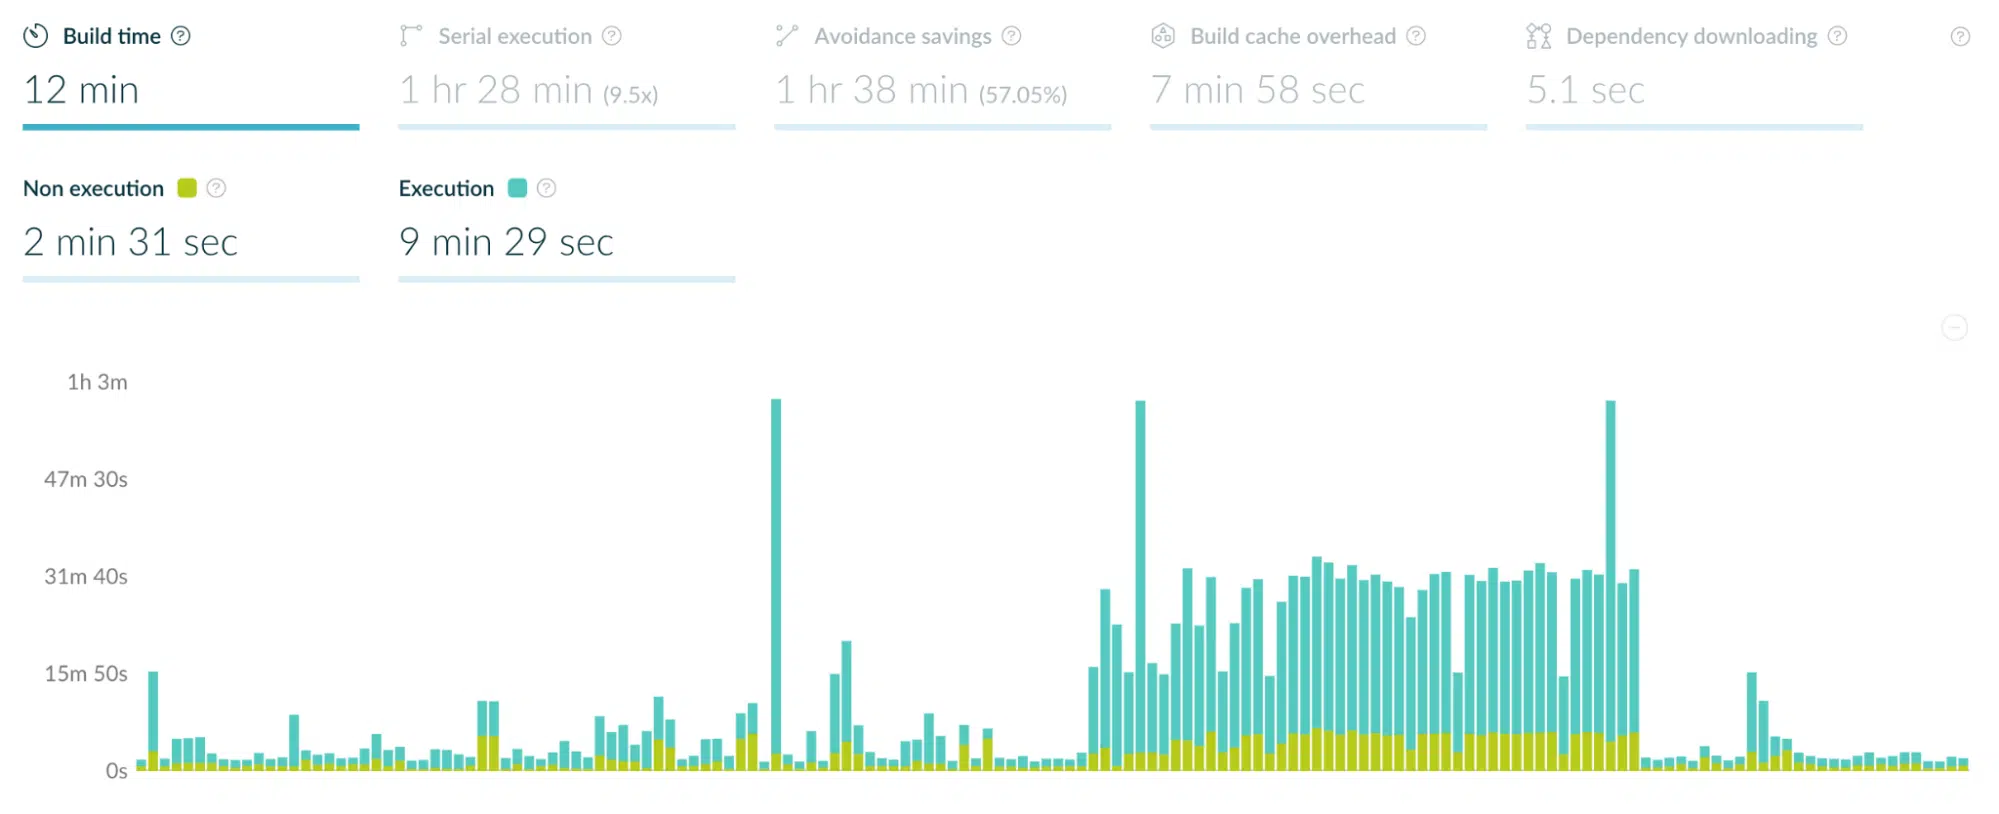
Looking at the build time graph, it’s pretty apparent when the builds slowed down:
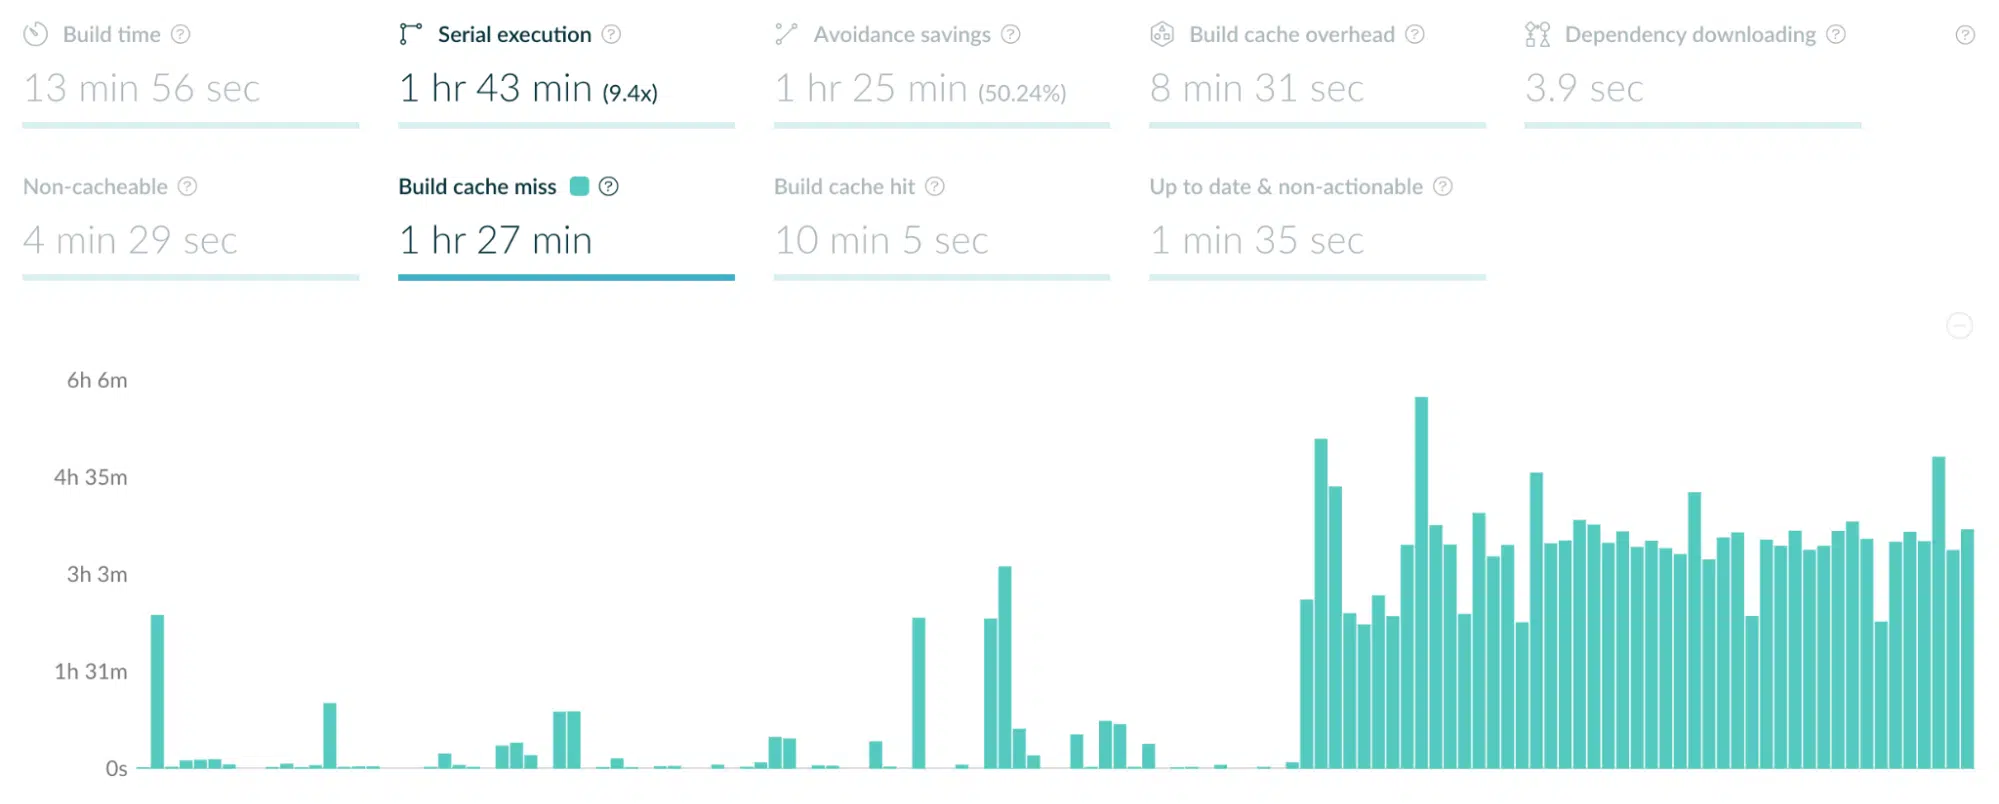
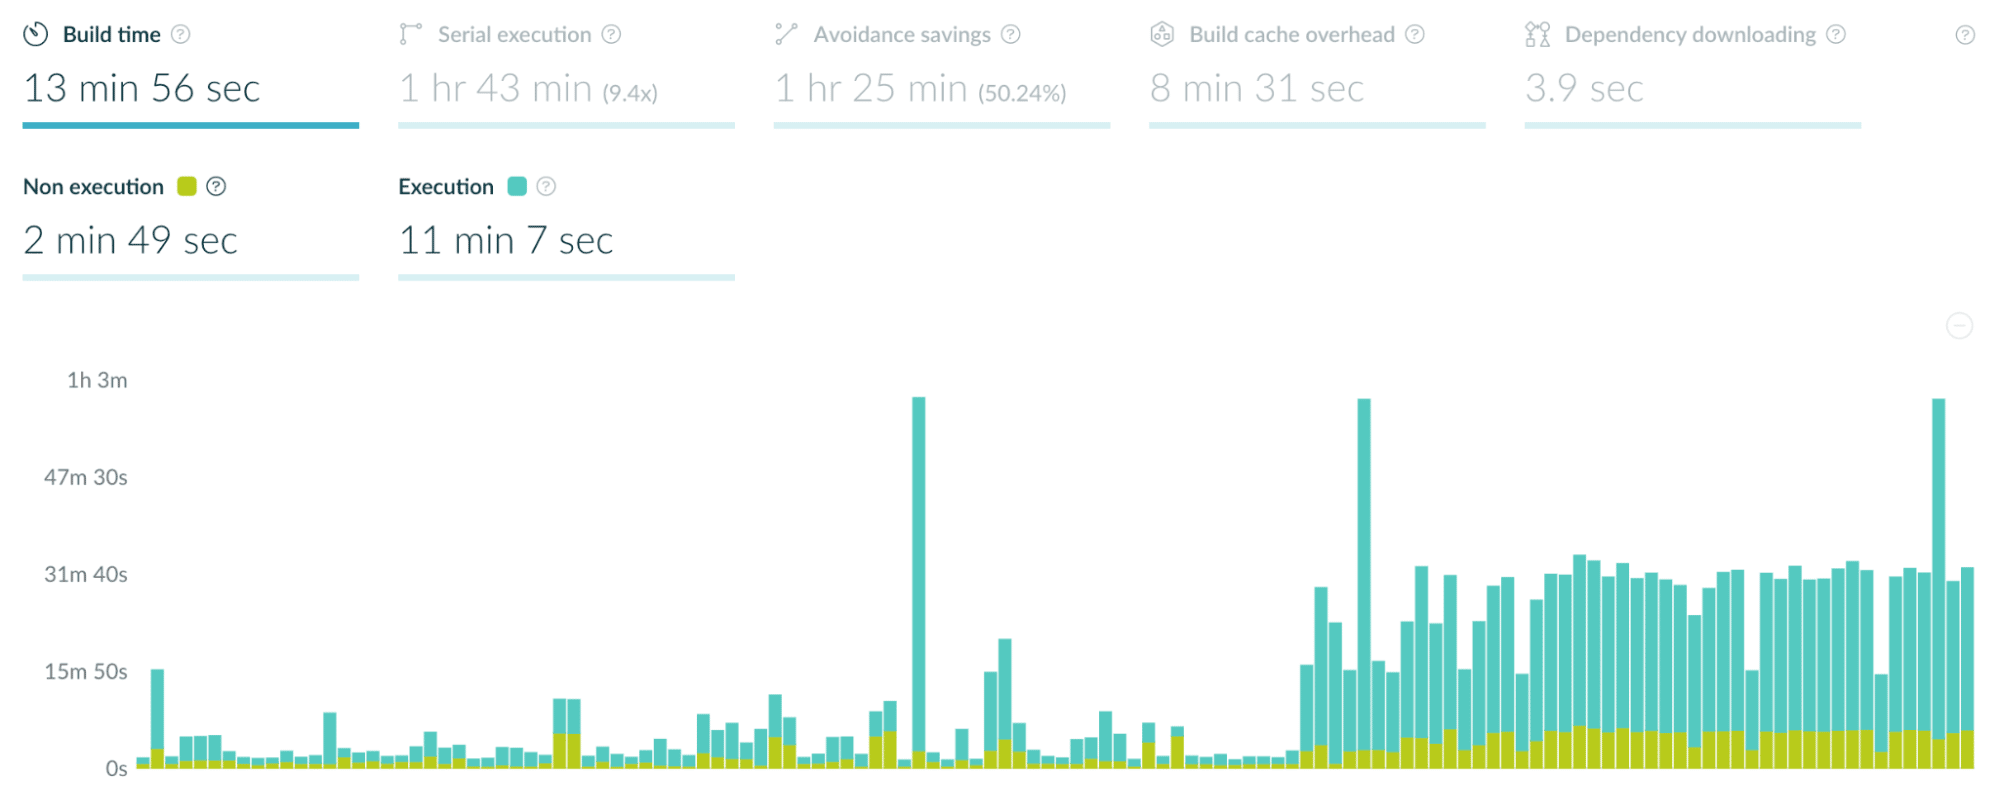 The aqua-colored part of each column represents execution time (the time spent on the build), in contrast to other available metrics like the time spent initializing Maven or the Gradle build tool. When the build cache node went down, every build was significantly slower than the builds before it.
Each column in the chart represents a single build. Clicking on any column in the chart provides more details: 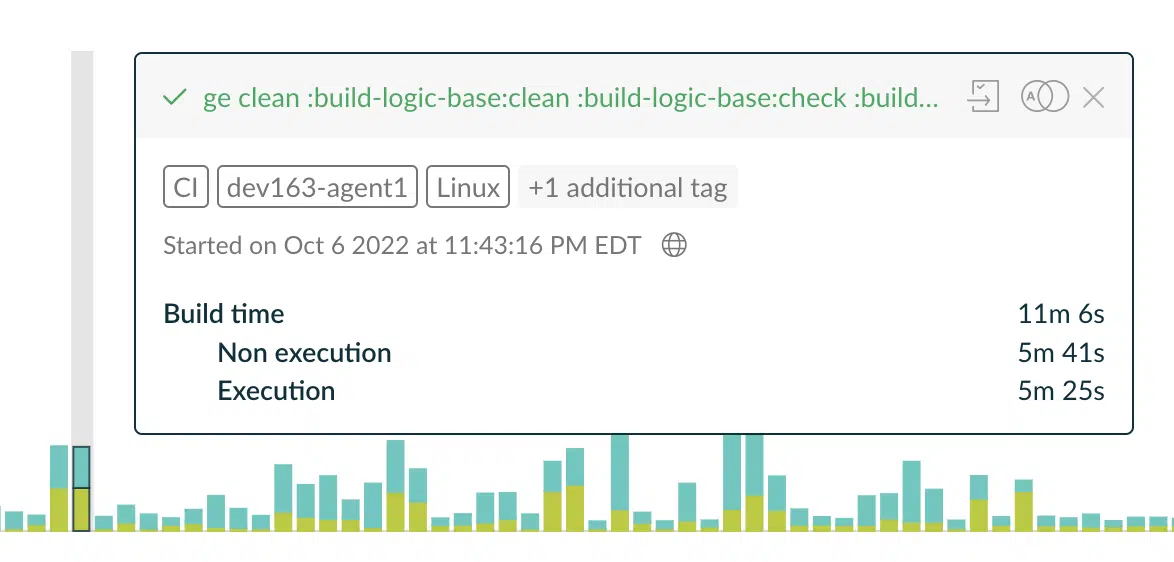 Here, we have about 5½ minutes of execution time. The build was successful (the names of the requested tasks at the top of the window are green), and we have more information about the tags associated with this build, the time the build started, and other details. If we want even more information about this build, clicking on the page icon takes us to the Build Scan to see all the data Develocity has for this build, and clicking on the icon with two rings lets us compare two builds.
Here are the details for a build that ran after the build cache node crashed: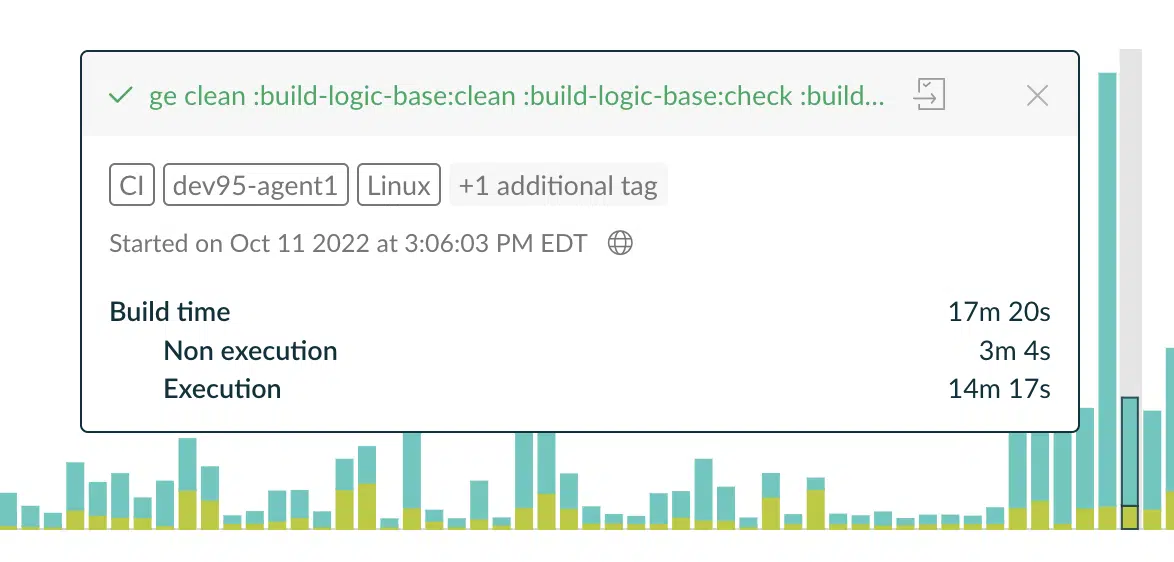 Notice that the execution time is more than twice as long. Opening the Build Scan for more details tells us what’s wrong:
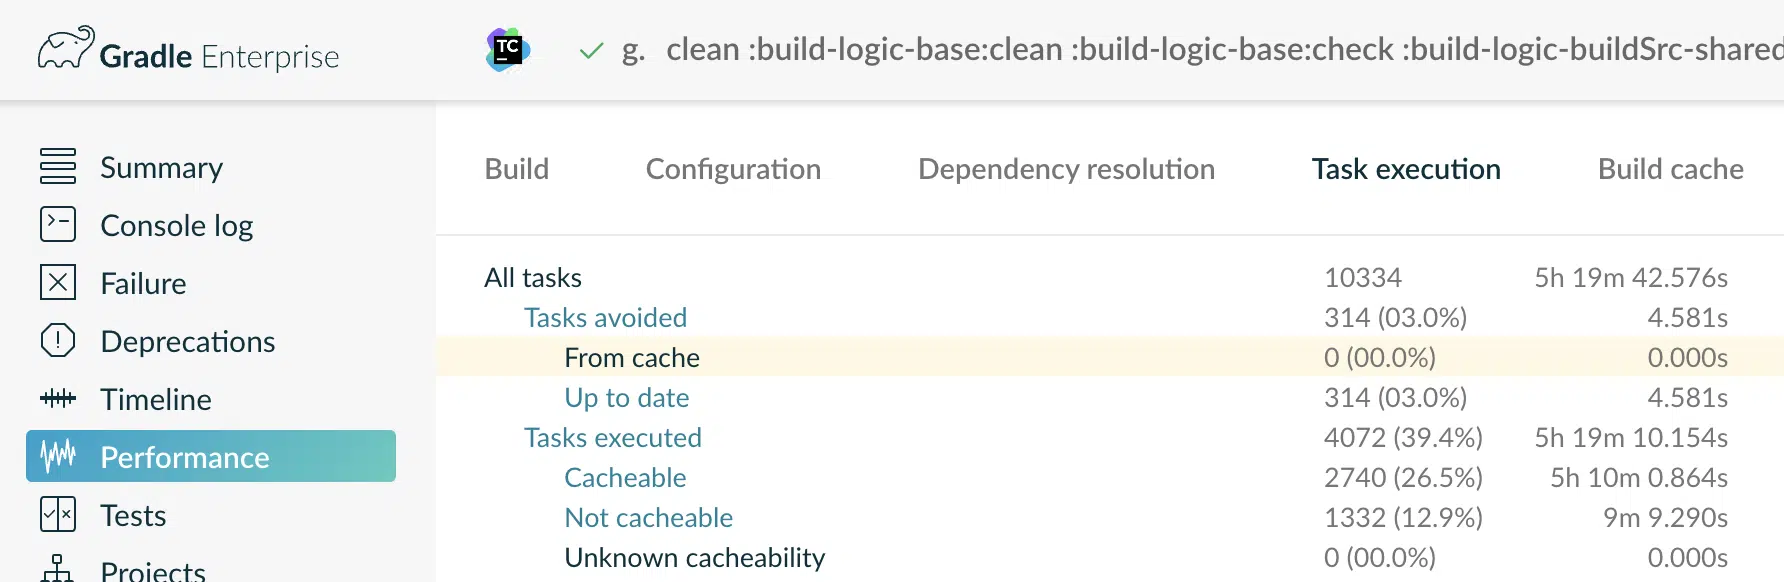
In the task execution panel, we had exactly zero hits in the cache. That sounds like the build cache node is down. Looking at the Build cache panel confirms this:
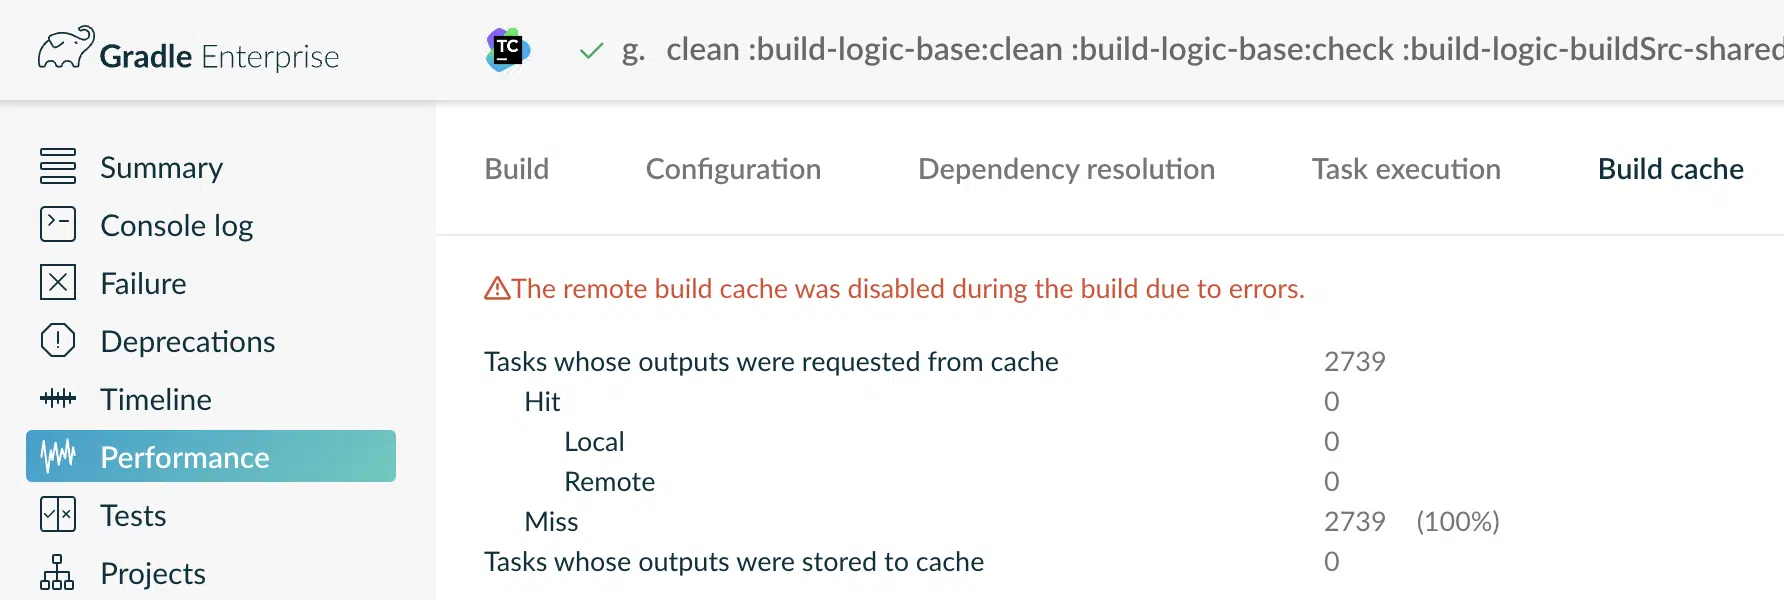
You can’t get any clearer than that. It’s time to open a ticket and let the operations team know there’s a problem with the build cache.
Going back to the performance dashboard, we can look at build cache misses:
Or the corollary, build cache hits:
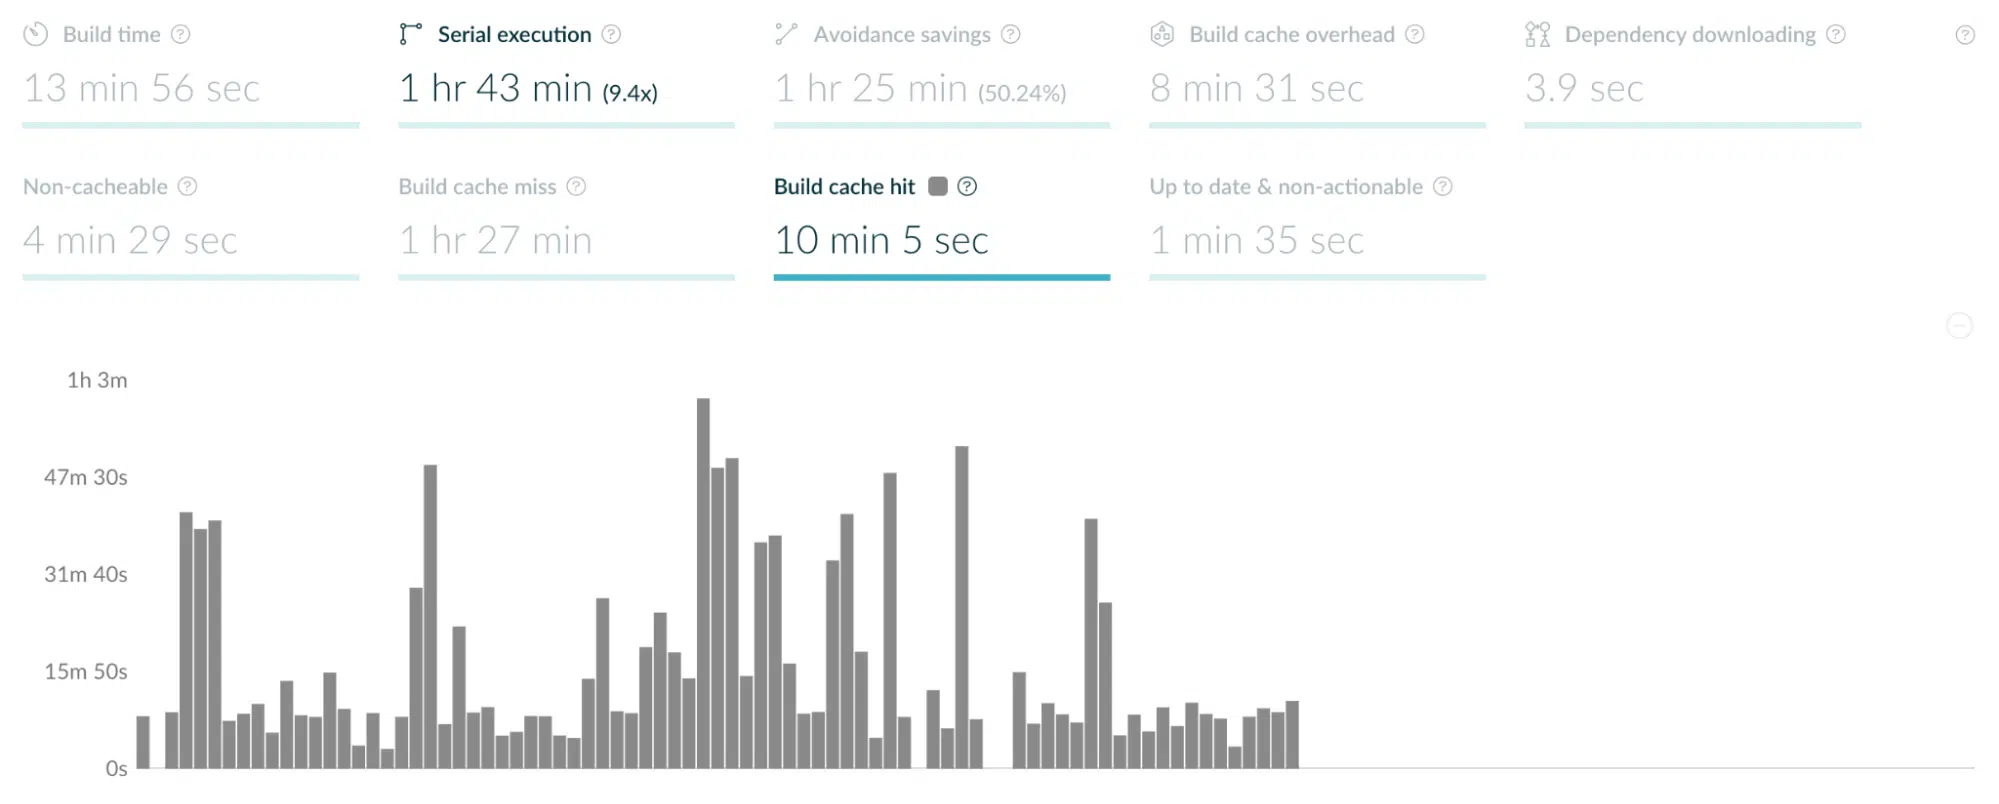 Because we have data for all of the local builds, it’s easy to see that the build cache node is down. If we only had Build Scans for CI builds, and no CI builds were run recently, we might not have any data at all. Individual developers doing local builds would probably notice that things are slower, but it would be difficult to determine the problem quickly.
All because we keep Build Scans for all of our local builds. (That’s important.)
The trends dashboard
We can move on to the trends dashboard to see more details:
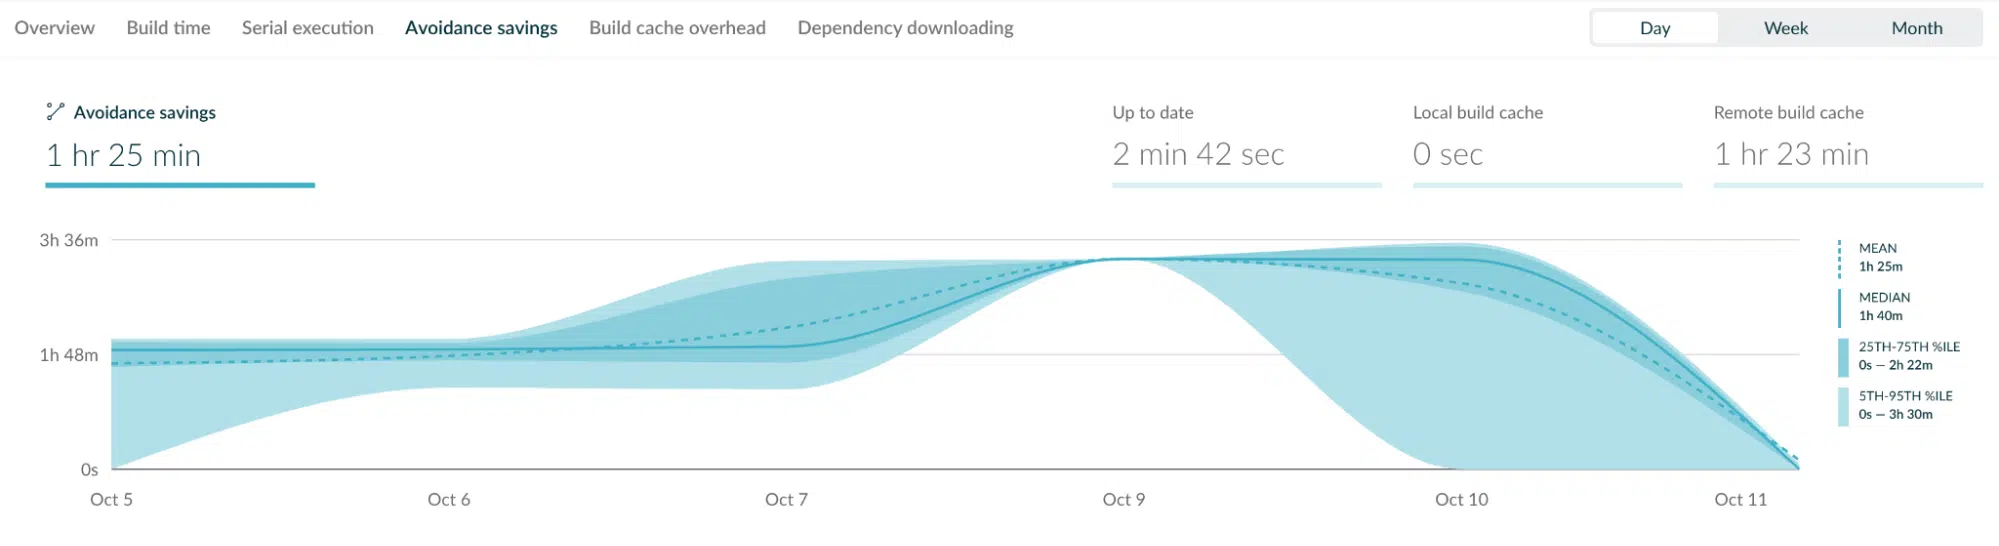 Avoidance savings are basically cache hits, and we can see that those savings nosedived on October 10th. We see similar results from the build time view:
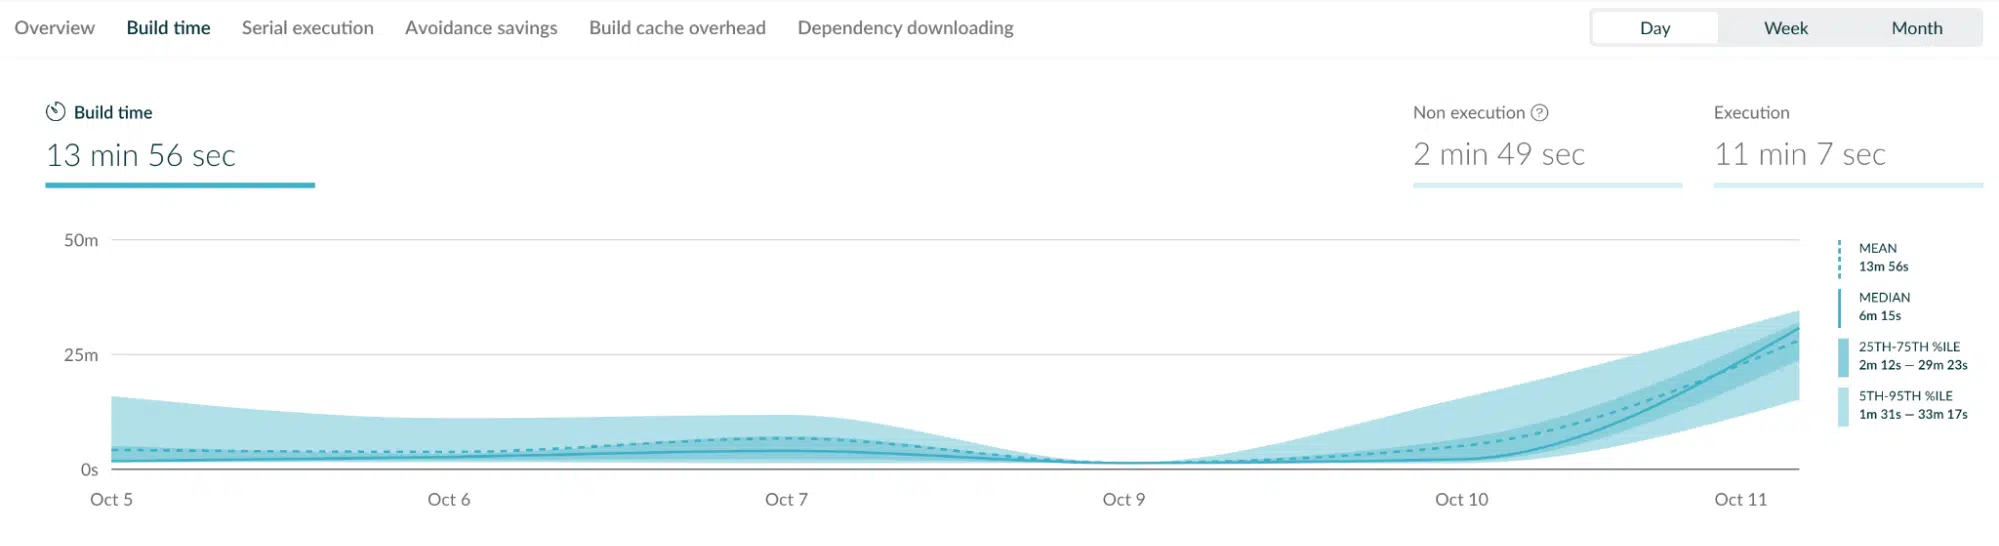 Again, build times go up significantly on the 10th.
One last thing
Before we go, here’s another look at the build time graph, this time showing builds that were run after the build cache node was back online:
 On the right side of the graph, build times are back to normal.
Conclusion
Develocity’s Trends & Insights, combined with the wealth of data from our local and CI builds provided by Build Scans, made it easy to spot the problem in our infrastructure. If we only had data for CI builds, the cause of the problem wouldn’t be obvious to anyone running a local build. An administrator would have no idea that anything was wrong until another CI build was run. Even if we did know something was wrong, without Develocity it would be much more difficult for an administrator to figure out what the problem was. Develocity is an excellent tool to precisely see what’s going on in your builds and your build infrastructure.