
 Observe
 Accelerate
 Troubleshoot


Let’s face it, slow builds are the bane of every software developer’s existence. We’ve all been there: you’re ready to push your code, but the build process takes forever. Or worse, the build fails, and you have no idea why. This kills your flow, morale, and productivity—and results in delays in getting your features merged and shipped.
Build performance issues can have a major impact on your team’s overall productivity. That’s where build performance observability comes in. By monitoring toolchain resource usage during your builds, you can identify bottlenecks and optimize your build process for maximum speed and efficiency. On the flip side, maybe your CI build isn’t hitting a bottleneck—which could indicate that your CI agents could be over-provisioned (hint: infrastructure cost savings! 🎉).
Why should you care?
When most developers think about application observability, they only think about it in the context of applications deployed to a production environment; however, it’s equally important for your build processes. Just like your applications, your Gradle, Maven, sbt, and Bazel builds can be complex and resource-intensive. And just like your applications, if something goes wrong with a build, it can be difficult to troubleshoot without the right data. That’s where toolchain observability comes in.
With build performance data, you can answer questions like:
- Why is this build taking so long?
- Is there a bottleneck in my build process?
- Would more powerful CI agents speed up my build?
- How can I optimize my build for better performance?
How does it work?
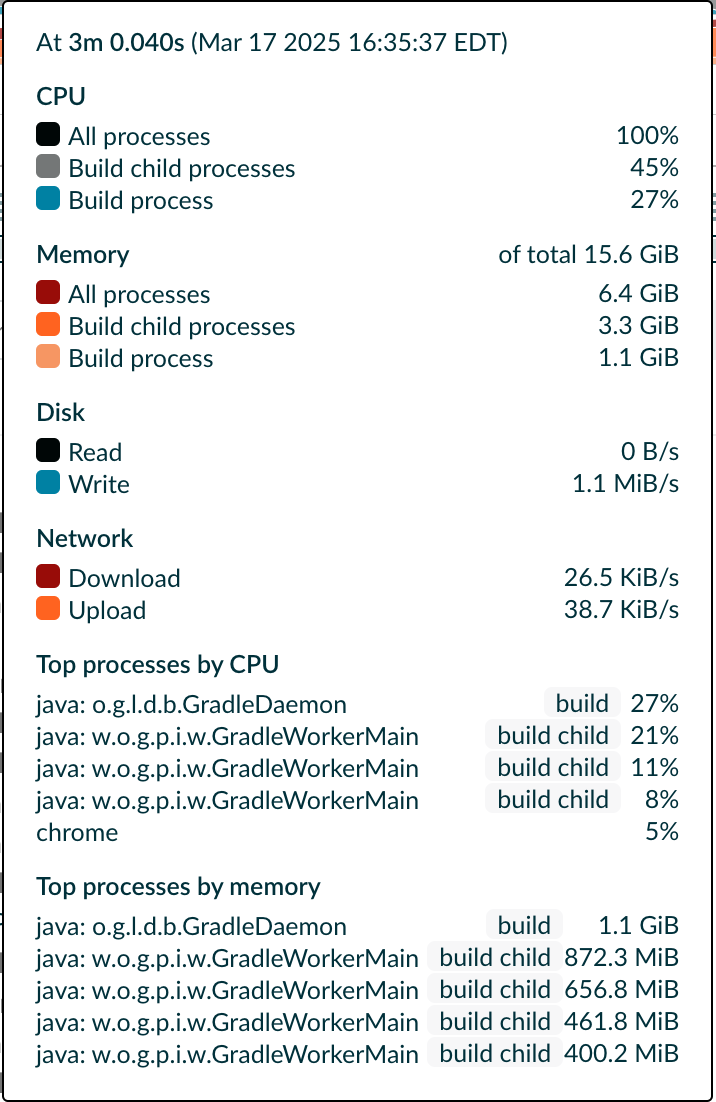
By monitoring resource usage during your builds, you can identify bottlenecks and optimize your build process for maximum speed and efficiency. For example, by using a free Build Scan®, you can track CPU, memory, disk, and network usage, and visualize this data to provide insights into build performance.
Your build’s resource usage is visualized as part of the Build Scan® timeline (image below).
With the Develocity IntelliJ plugin you are able to see CPU and memory usage in the live timeline view while running a build.
Key metrics and what they mean
Optimizing your build performance involves close attention to key resource metrics. By understanding how your build utilizes these resources, you can pinpoint bottlenecks and implement targeted improvements. Some of these might be obvious, but let’s explore these critical metrics and their implications for your build speed and efficiency.
CPU usage
This metric tells you how much of your CPU’s capacity is used by not only your build processes, but other processes on your machine. In fact, one Develocity user told us that they discovered a major slowdown in build times due to newly-installed anti-virus software that was using a significant portion of their CPU and memory.
High CPU usage could indicate that your build is CPU-bound and could benefit from upgrading hardware or profiling the build to identify specific CPU-intensive tasks.
Low CPU usage might be an indication that the CI agents are over-provisioned, or that the build isn’t taking advantage of the available CPU cores.
Example bottleneck: If your build is using 100% CPU for extended periods, it might be time to upgrade your build server.
Looking at the above build from the Apache SCIMple project, we can see that the CPU is pegged by the build and its child processes. In this example, the Maven build has spawned a child process to run unit tests (with the Surefire plugin), adding to the CPU load. A faster CPU or one with more cores would likely improve the build time.
Memory usage
This metric shows you how much memory your build process (and other processes) used in the build. If your build runs out of memory, it will fail or thrash, which can significantly slow it down. Similar to CPU usage, it may be helpful to look at the other processes consuming memory.
Example bottleneck: If your build consistently uses a large amount of memory, you might need to increase the amount allocated to your build server, or reduce the amount of parallelism in your build (as the child processes also consume memory).
Disk read/write throughput
This metric measures how much data your build is reading from and writing to disk. Slow disk I/O can be a major bottleneck in your build process. For example, your average Java build will read in many JAR files and .java source files, compile them, and output .class files. Those .class files are then repackaged as a JAR file and written to disk. Each one of these steps requires reading and writing files to disk.
Example bottleneck: If your build is spending a lot of time reading and writing to disk, you might need to upgrade your build server’s disk or avoid using a network share in your build.
Network download/upload throughput
This metric measures how fast your build is downloading and uploading over the network. Slow network speeds can be a bottleneck, especially if your build is uploading large artifacts.
Example bottleneck: If your build is spending a lot of time downloading dependencies, you might need to optimize your network, use a local dependency cache, or add a repository manager on the same network.
Use cases
Here are a few examples of how build observability can help:
- Identifying & troubleshooting bottlenecks: By monitoring resource usage, you can quickly identify which parts of your build process take the most time and resources.
- Optimizing build performance: Once you’ve identified bottlenecks, you can take steps to optimize your build process for better performance.
- Right-sizing your build infrastructure: By understanding your build’s resource requirements, you can ensure that your build server has the right amount of resources to run your builds efficiently.
- Organization-wide visibility: Get answers to a range of specific queries, such as which team in your organization has the slowest builds, whether any projects are using outdated or vulnerable frameworks or tools, or whether a migration from Java 11 or Java 21 was successful across all projects or not.
Learn more about toolchain observability
As with application observability, where continuous monitoring is essential to maintaining performance and stability, toolchain observability is not a one-time fix. Your build’s resource utilization can shift significantly as your codebase evolves, dependencies change, or infrastructure is updated.
Regular monitoring and analysis of build metrics will ensure that you can proactively identify and address new bottlenecks, keeping your build process optimized and your team’s productivity high.
For Java, Kotlin, and Scala projects (Gradle, Maven, and sbt) you can view the resource usage of your builds and many other observability data points for free by using scans.gradle.com. For Gradle, you can also use the Develocity IntelliJ plugin for free to get live resource usage insights within your IntelliJ IDE.
You can also learn more about toolchain observability with these resources:
- Java developers: Get what you want with observability and data
- How Develocity CI Build and Test Observability Offer Deep Migration Insights
- Monitoring build performance at scale
For more exciting content, follow us on X, LinkedIn, or subscribe to our YouTube channel.
Finally, if you want to see how Develocity performs in your own environment, request a guided trial. Working hand-in-hand with Gradle engineers, you’ll use your own data to get real results.