Develocity automatically observes, records, and reports details about your CI builds. This information provides the basis for generating performance and failure-related insights and developing metrics to make CI pipelines more efficient. This automation allows CI and DevOps Engineers to focus on sustained improvement instead of tech support. In this article, we’ll define some of those key CI metrics and explore real-world examples of Develocity helping teams to optimize CI performance and failure recovery using those metrics.
Build Performance Analysis
Most enterprise builds consist of many disparate steps and phases, each of which can differ in complexity and time to execute. Engineering organizations with shared CI maintain thousands of multi-module projects. Achieving a fully optimized build requires analyzing every single one of these steps and seeking improvement where possible.
Gradle Build Scan collects granular performance details about every build, locally and in CI. Each step of the build, from the time spent reading configuration files, downloading dependencies, packaging code, and everything in between is accounted for and made easily visible:
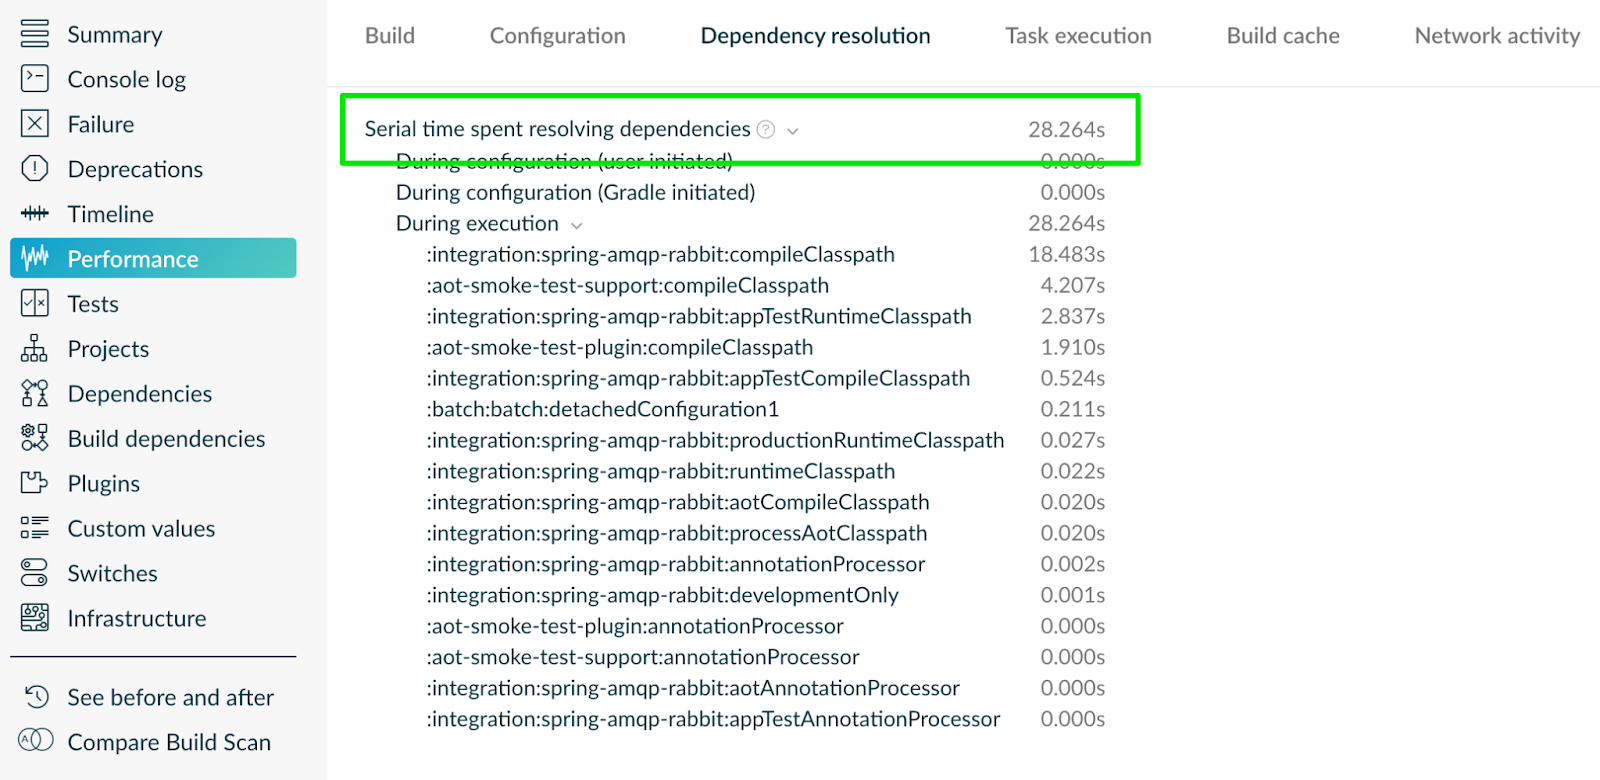
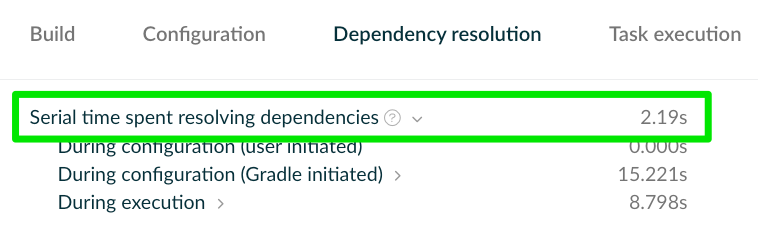
Fig 1: Details such as time spent during dependency resolution are recorded and presented
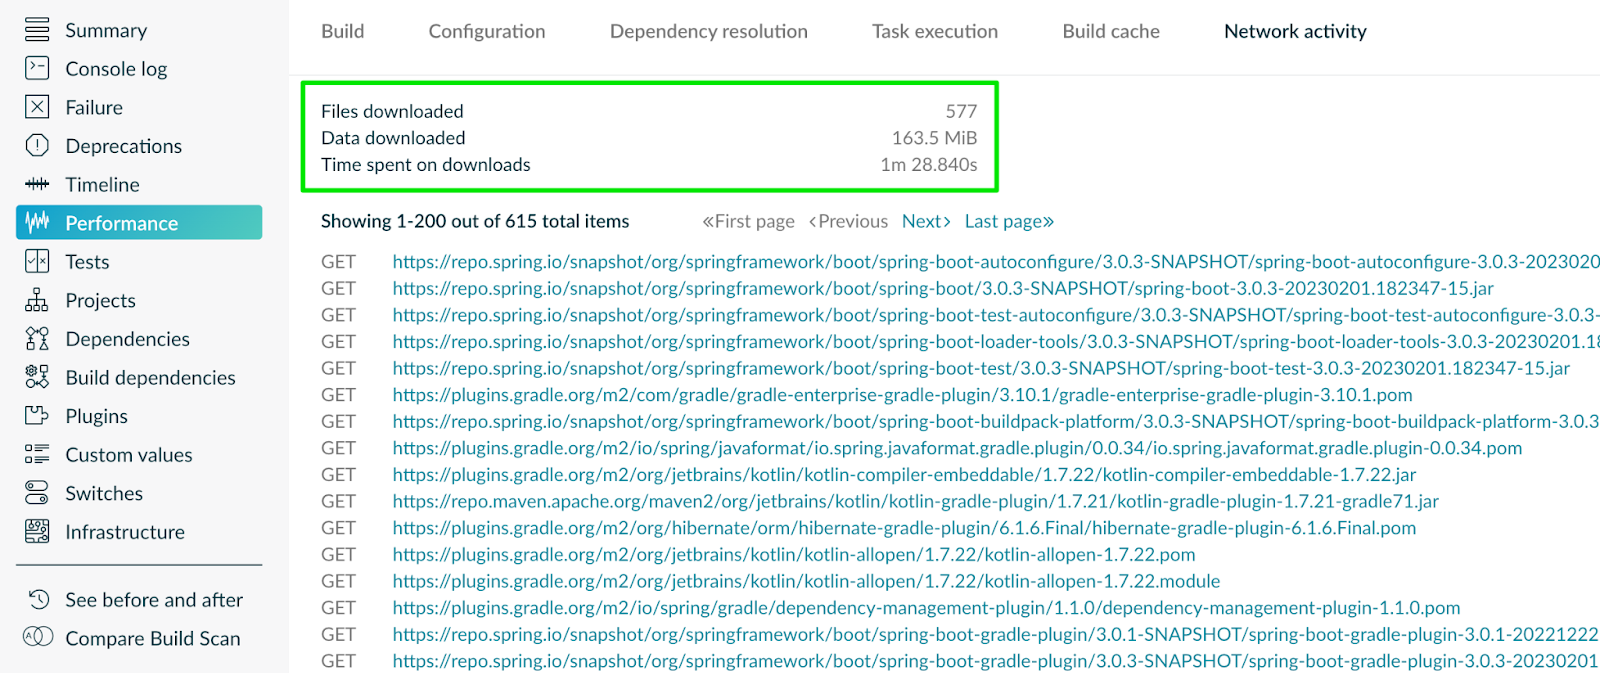
Fig 2: Build system network activity is made visible through a Build Scan
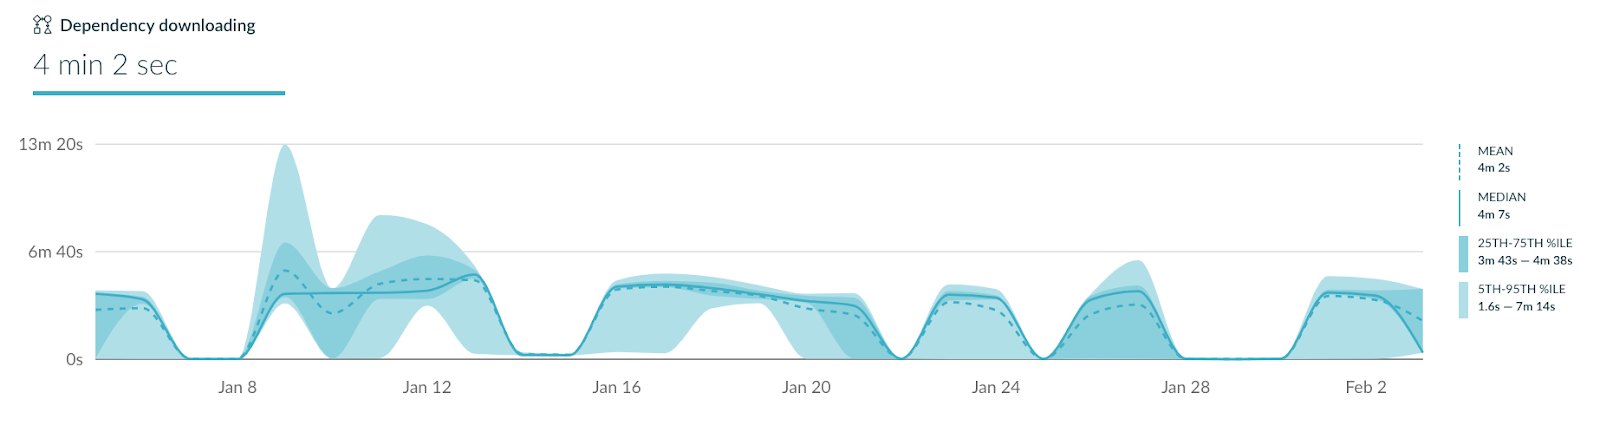
Fig 3: Trends can also be observed through visually appealing charts
That’s just the beginning, a wealth of details and metrics that are relevant to improving your CI pipelines are available, including but not limited to:
| JVM Heap / Memory Usage | Understand the impact to performance memory configuration may have to a build |
| Operating System | Learn which operating system the build took place on |
| CPU Cores/Threads | See the total CPU resources available to the build process |
| Locale and Charset Details | View the locale and charset settings that were enabled at the OS-level during the build |
| Build Failure Rates | See how often builds are failing and for what reasons |
| Test Flakiness Rates | Calculate how often individual tests are acting in a non-deterministic way and take action |
| Configuration Flags | Validate which configuration flags were set during a build |
| Build Deprecations | Understand if the build includes any deprecations that should be considered for the future state of the toolchain |
By capturing and organizing build telemetry in this way, Develocity can help CI teams understand pipeline bottlenecks and address them quickly. Most CI solutions simply don’t provide this level of visibility into what the build tool is doing, so these details are often difficult to surface. Build performance problems that lead to issues like CI agent backlogging are recognized immediately, and remediation can be prioritized based on easily accessible impact data.
Customer Case Study: Backend Java Team of a “Top 5” Global Financial Services Institution
A development team at a large bank was experiencing wildly inconsistent build times, ranging from as little as five minutes to over an hour. Out of the box, Develocity provided task-level visibility, which was instrumental in quickly discovering and prioritizing opportunities to improve speed.
Slow Dependency Resolution in CI
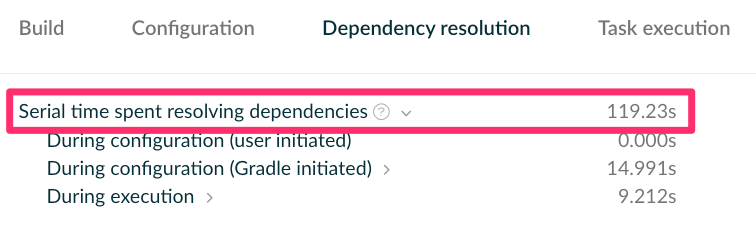
A quick glance at a Build Scan™ of a long-running build easily revealed the most impactful problem, unreasonably long dependency download times:
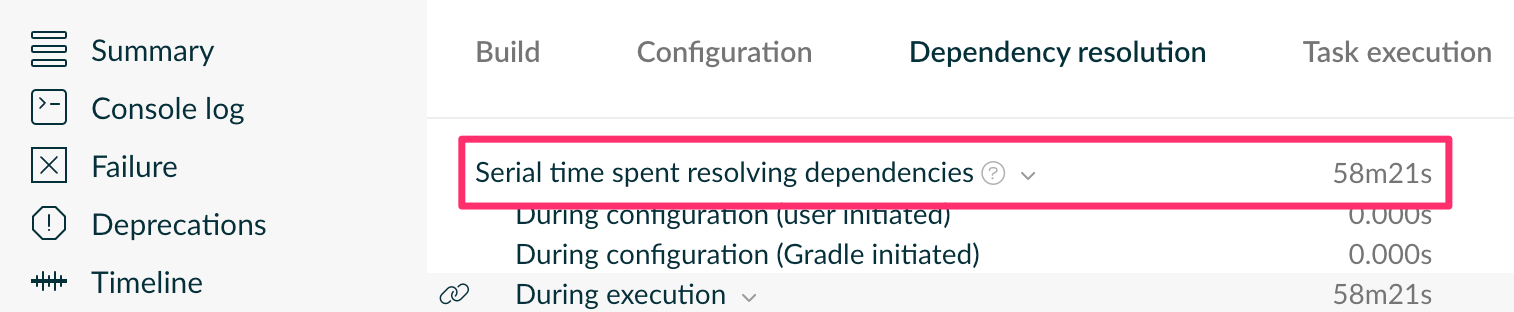
Fig 4: Performance data revealed that many builds were taking an hour to download dependencies
Digging into more Build Scans revealed that download times were highly inconsistent, leading to the unexpected variability in cycle times that the team was experiencing. By introducing better dependency management infrastructure, such as improved dependency caching, dependency resolution times were greatly improved. Resolution time was tracked (see Fig. 2 above) over time to ensure regressions were not introduced.
Suboptimal Build Configuration
The second major performance issue that Develocity surfaced was an improper Gradle build configuration. Gradle provides parallelism, allowing multiple build tasks to run concurrently, greatly improving build speeds. Though the team was building on a powerful 16-core instance, the build wasn’t configured to take advantage of this.
The team didn’t have to dig deep to determine this, as the data is included in both the “Summary” tab of the Build Scan for every build, as well as the “Switches” tab:
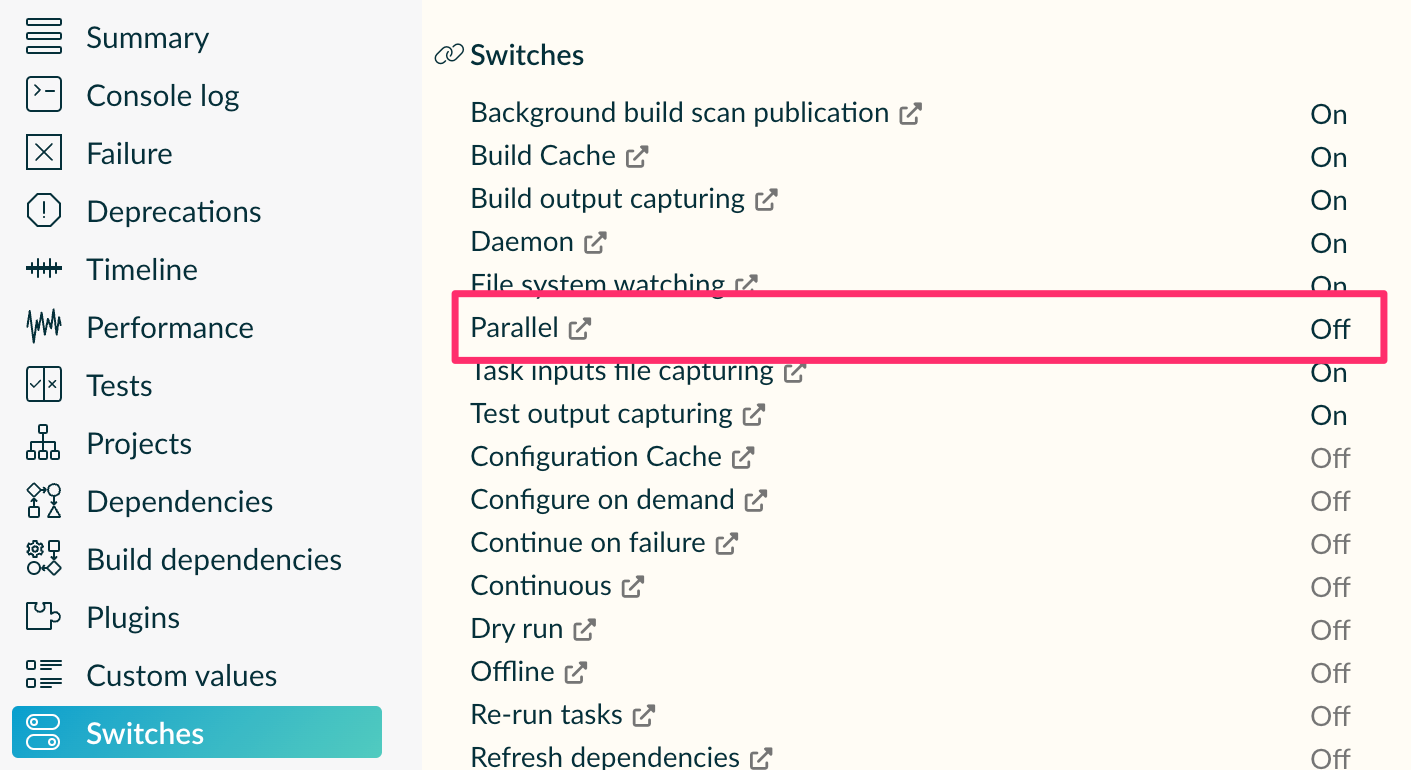
Fig 5: Build configuration switches can be viewed alongside other data
Enabling parallelism in the build increased build speed times by 40% on average, and all of this optimization was possible without ever leaving the Build Scan interface.
Avoidable Cache Misses
The team configured the Gradle build tool’s caching capabilities, but the Build Scan timeline feature revealed that a number of Cacheable tasks were still being executed. Build Cache details are notoriously difficult to debug without good tooling, and this feature provides an analytical method to drill down and find problematic tasks quickly.
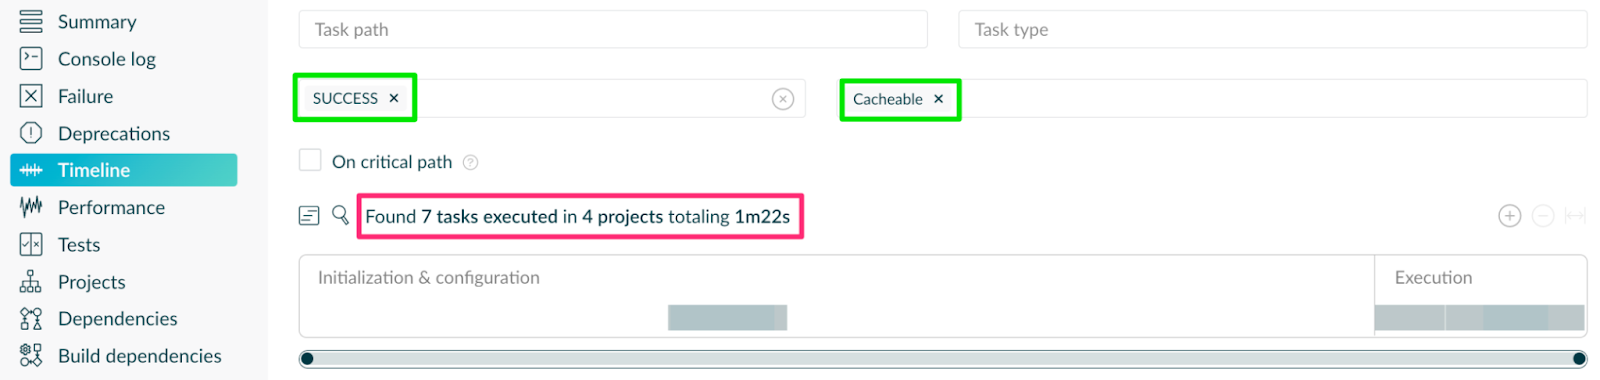
Fig 6: The timeline view can provide insights into caching behavior
Effectively, the filters (highlighted in green above) ask Develocity to report on how many cacheable tasks were executed. Ideally, that number would be zero, since everything cacheable should come from cache. The interface instead revealed that several tasks weren’t optimized for cache, offering further opportunities to improve build speeds.
Customer Case Study: Mobile Development Team from a “Top 3” Global Credit Card Services Company
Switching from one solution to another can often have unintended consequences, which was the case for the mobile development team at a global payment services company. The company was undergoing a planned migration from Jenkins CI to GitHub Actions. Upon completing the migration, the team observed that PR builds initiated by GitHub actions were significantly slower than builds initiated from Jenkins.
Different CI Architecture = Different Dependency Caching
With Develocity, the teams could compare build telemetry data across multiple builds easily. By tagging the builds according to their CI provider, i.e., Jenkins or GitHub Actions, it was easy to see that dependency downloads were much slower coming out of GitHub Actions.
 |
 |
| Jenkins Build | GitHub Actions Build |
This helped them surface that the Jenkins server was caching dependency artifacts while the GitHub actions build was downloading the artifacts on each run, which was detrimental to the overall build time.
Build Scan Custom Values Broadens CI Observability Potential
Upon fixing the issues with artifact caching, the build pipeline’s performance in GitHub Actions was still not as optimized as the Jenkins build. The team used some shell-level commands in the build script data to populate custom values indicating read-write data from iostat.
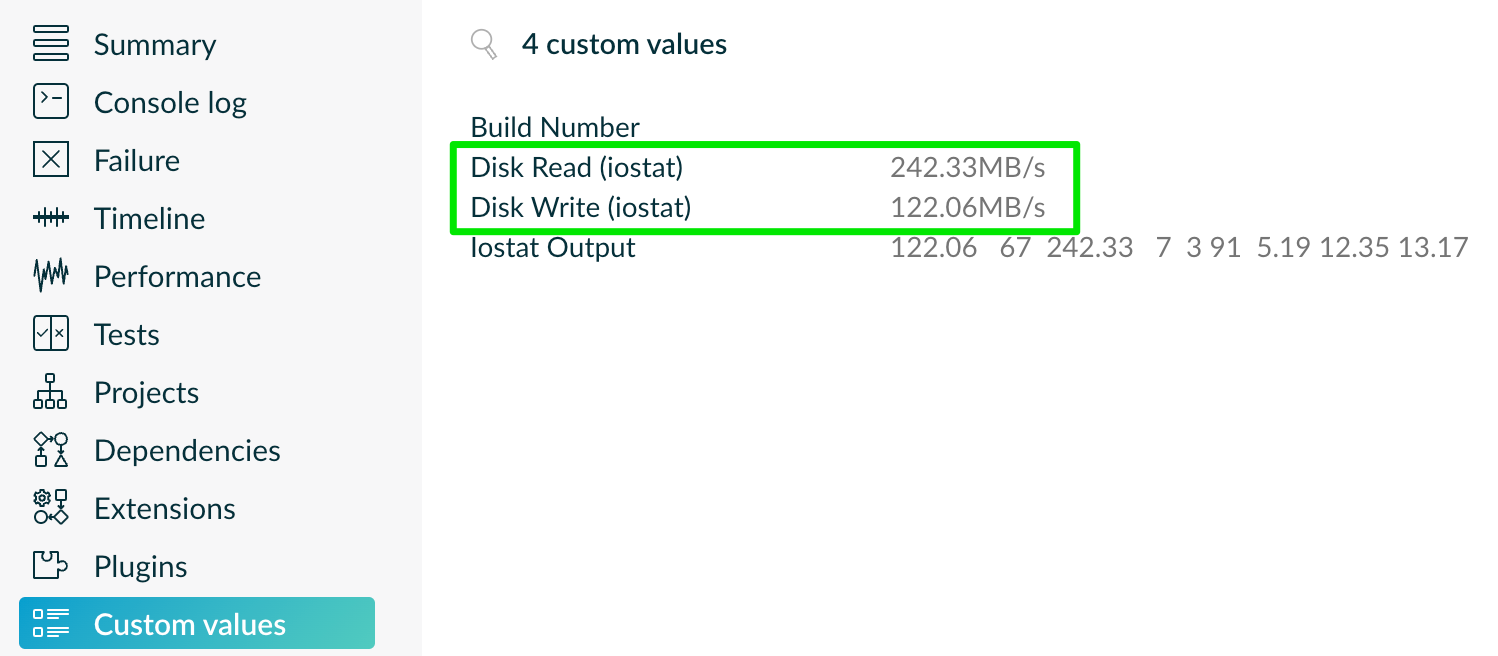 |
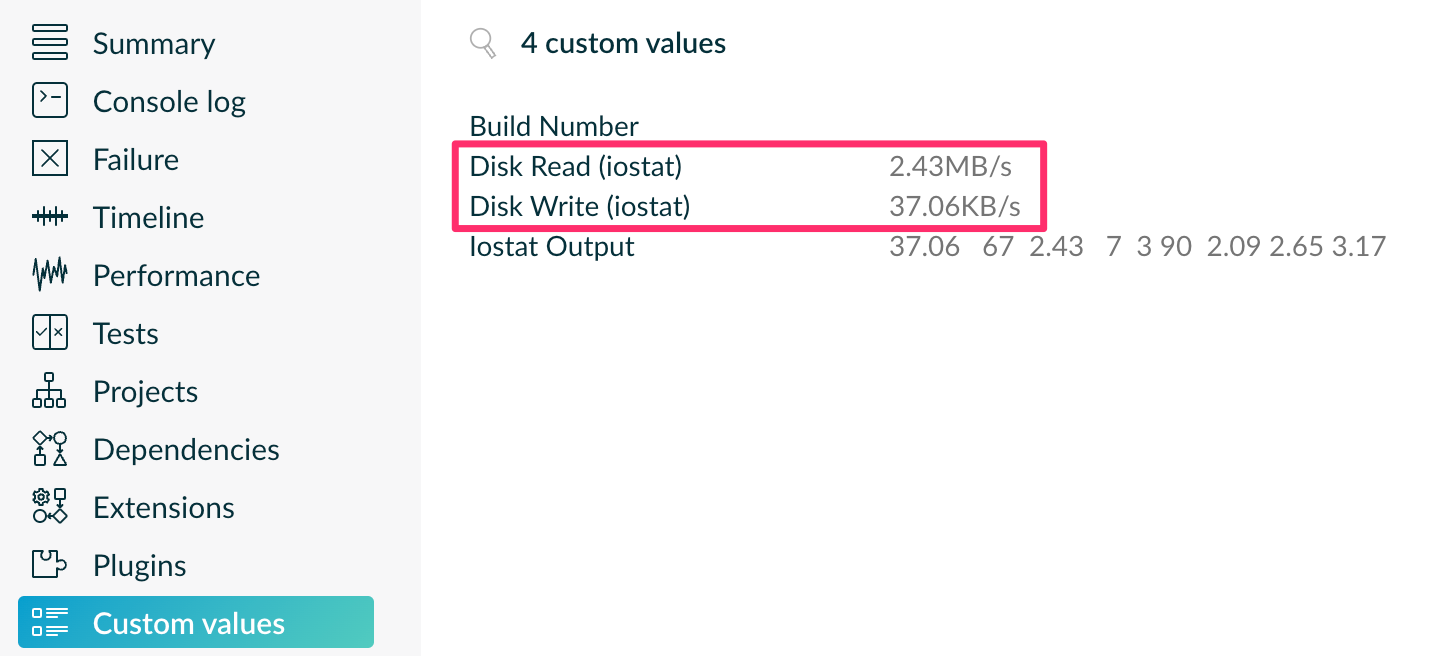 |
| Jenkins Build | GitHub Actions Build |
Given the distributed nature of the builds, it would have been very difficult to gather information about the speed and health of the build environment without being able to capture these details in Develocity. Since very granular data about storage speed could be gathered and viewed over time, the team was able to easily optimize storage fabric and improve speeds even further.
Measure and Improve Your CI Builds with Develocity
Develocity provides a suite of solutions to make your Maven and Gradle CI builds faster, more efficient, and easier to troubleshoot. Have a Maven or Gradle build that you’d like to visualize? Try a free Build Scan right now and learn what insights you can gather.