
 Observe
 Accelerate
 Troubleshoot


We’re excited to announce Develocity Analytics.
Develocity has always had three facets:
- Acceleration technologies
- Troubleshooting and reliability
- Data and analytics
Until now, users could access data and analytics through the reports and charts available on the Develocity dashboards or via the Develocity API. But the data that Develocity collects and collates is so valuable for providing insights into developer team productivity that we thought it essential to make it even easier to access, understand, and query. This is why we’re excited to share Develocity Analytics with our customers.
What is it?
Develocity Analytics is a new capability available to Develocity customers. Under the hood, it uses a familiar toolchain for querying and reporting the local and CI build data that’s available in Develocity. The data is then fed into Grafana, so you can use the full power of a tool designed specifically for visualizing and understanding data.
While it’s part of Develocity’s suite of features, it has a separate release cycle compared to the Develocity server—this enables us to iterate quickly and bring you the most relevant queries and reports as rapidly as possible. If you’re interested in the nitty-gritty of the architecture, we’ll get into that a bit later in this post.
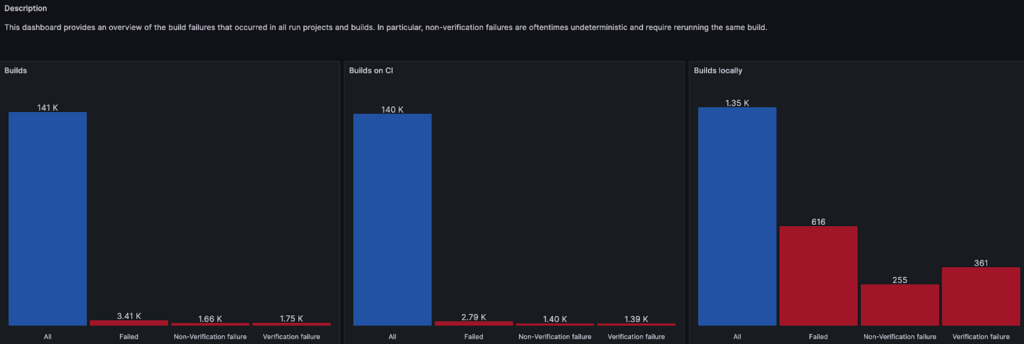
What does it show?
The Grafana dashboards give customers out-of-the-box visibility on a range of data that is available via the build system. For example:
- Number of projects using each supported build tool
- Number of builds in CI vs local builds
- Number of failed builds vs successful builds
- JVMs (vendor and version) used across all builds
- Which Git repositories are being built in which environments
…and so on.

Some of this data was previously available within Develocity’s dashboards, but now there’s much more data available and it’s much easier to explore from within Grafana. Since Grafana itself is a data visualization tool that many are already familiar with, we hope our customers can easily begin exploring this data right away.
Who is it for?
We like to think it’s for everyone! However, we also understand that different people in different roles are going to be interested in using Develocity’s data to see or discover different things.
Developers will be able to use the data to gain visibility to problems that are impacting their productivity. For example, they might highlight that their local builds have worse performance than CI builds; show that their project would benefit from upgrading JVM or library versions; or see, compare, and collate build times for all the microservices they contribute to.
Platform / DevEx Engineers can get a view of all the projects for which they’re responsible. They can see which projects and teams could benefit the most from applying acceleration technologies, get visibility over projects or environments that suffer from poorer build and test reliability, and use Develocity Analytics to expose metrics highlighting the work they’ve done and improvements they’ve achieved. The data about which projects are consuming the most build time and where those builds are happening can help give a better picture of what contributes to the costs of environments like CI.
Engineering Leaders will have visibility of data across all projects. They can see the progress of initiatives like migration or upgrade efforts—for example, of CI systems or JVM versions. They’ll be able to see if projects are not being actively built in any environment or if projects are unexpectedly being built!
How does it work?
We’ve now discussed Develocity Analytics as a new capability of Develocity, but you may be interested in the toolchain and under-the-hood design to get a better understanding of what’s being offered and how. We offer two approaches to freeing up the Develocity data for you to use effectively.
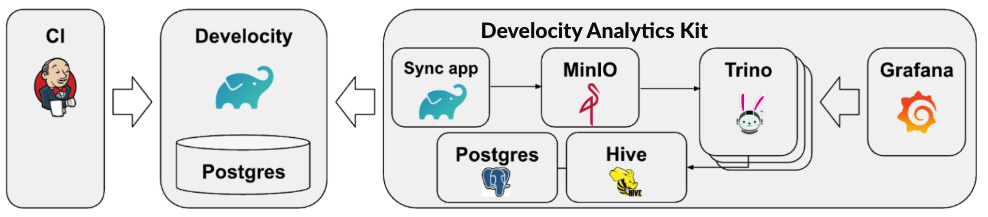
1. Develocity Analytics Kit standalone service
The first option includes everything you need to get started and is opinionated on the software and platform it will use. It comes with preconfigured Grafana dashboards and queries, so you can dive into your build data straight away.
2. AWS Athena/S3 cloud integration
The second option requires you to use AWS (support for other cloud platforms like GCP and Azure is in progress). It offers the opportunity to customize the queries run against the data from Develocity via Athena.
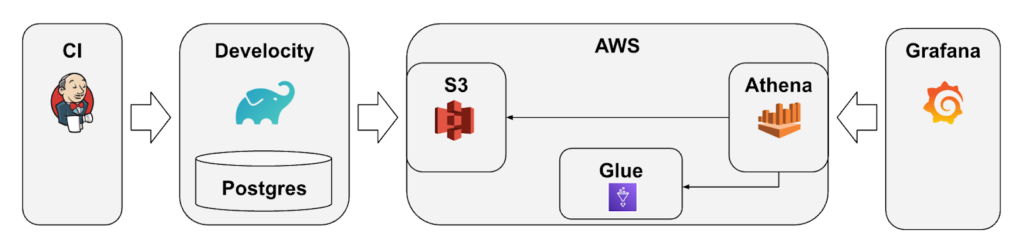
Elements of this software stack are designed to be replaceable, so you can use the tools you’re accustomed to rather than being constrained by our choices.
The out-of-the-box reports and charts will give you information about the builds in your organization right away. But there’s more—you can write your own queries, create your own dashboards, and slice and dice the data to get real insights into what’s happening in your development organization.
Next steps
If you’re using Develocity 2024.1, great news! You already have the capability to use Develocity Analytics—just get in touch with your Account Executive to get started. If you’re not yet a customer, contact us for a product demo.
N.B. One last thing! Develocity Analytics is under active development and is evolving rapidly. The standard dashboards will evolve as we discover what’s most valuable for large-scale development organizations. Support for more environments is on the roadmap, and more data is being added to the models.