![]()
This article is outdated and contains information that is no longer accurate. Please reference the Develocity Analytics page for more details.
Introduction
Monitoring and analyzing build performance though Develocity is crucial for optimizing feedback cycle times. There are cases where it may be desirable to combine Develocity’s build metrics with other datasets and render the results visually. Moreover, it is not always practical to swivel-chair between different dashboards when looking for high-level data. Instead, it may be desirable to create alerts when a certain behavior is observed. The Enterprise API, which will soon replace the deprecated Export API, can query for a number of data sets within Develocity, such as:
- Feedback cycle metrics and Build Scan® data
- Build Cache node data
- Server metadata
- Test Distribution data
This post explores how developers can extract Build Scan data from the Develocity API and push that data into the popular Prometheus database for alternative visualization and analysis through Grafana. We do not cover Prometheus AlertManager in this post, but it can certainly be used in conjunction with the exercise described below to configure threshold-based alerts.
Preface
Before we get started, a quick note on Prometheus. Although we will be using the PushGateway in this exercise to move metrics into Prometheus, this may not be the best solution for what you are trying to achieve. If your plan is to pull data on individual builds and represent metrics over time, remember that by its design as a time series database, Prometheus does not easily allow you to override the timestamp it places on metrics as you enter them. Put differently, there is not a supported way to force Prometheus to store a metric against a Build Scan timestamp. The preferred Prometheus design pattern is as a scraping mechanism. If your goal is to export Build Scan data, such as the Build Duration metric captured in this exercise, you may consider a different Grafana-compatible backend such as ElasticSearch.
In this exercise, we will set up a system that pulls Build Scan metric data from the Develocity API on a fixed schedule, and pumps those metrics into Prometheus as soon as it learns about them. This will allow the metrics to be stored against a near-accurate timestamp of when the build took place.
You can reference the GitHub project here for a full code example of the snippets below:
https://github.com/gradle/blog-gradle-enterprise-api-to-prometheus-example
Walkthrough and Guide
1. Setting up Develocity API Access
Start by setting up your access to the Develocity API, which allows for exporting Build Scan data programmatically. Ensure that you have Develocity configured and the necessary permissions to access the Enterprise API. The Enterprise API uses Bearer Token authentication, so you will need to obtain a Develocity Access Key.
You can retrieve an existing access key from within the hidden .gradle directory in your home directory, or you can create a new access key in Develocity. If you have already provisioned a Develocity client on your machine by activating the Develocity plugin, you can use that access key to provide access to the API.
Retrieving an Existing Key
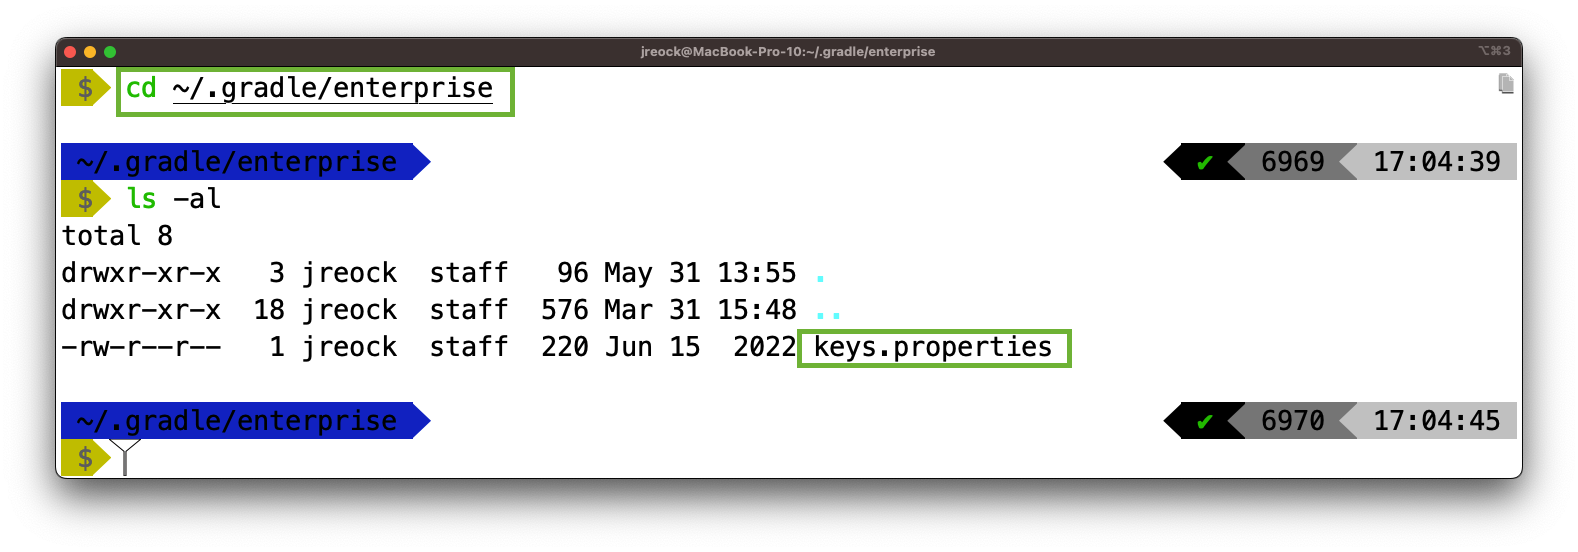
Locate your .gradle directory. On UNIX-like machines, by default this will be:
~/.gradle ← Where ~ is your home directory
And on Windows Machines, by default it will be in:
C:\Users\[username]\.gradle ← Where C:\ corresponds to the hard drive containing the “Users” folder
Once you’ve located the directory, navigate to ./enterprise and locate the keys.properties file.
For Maven builds, instead of .gradle, the keys.properties file will be in .m2/.gradle-enterprise.
Open the file in your favorite text editor and find the key that corresponds to the Develocity server hostname that you wish to query.
The format will be:
[server_dns_hostname]=[access key]
Keep track of the access key and the URL of your server, you will need them in later steps.
Creating a New Key
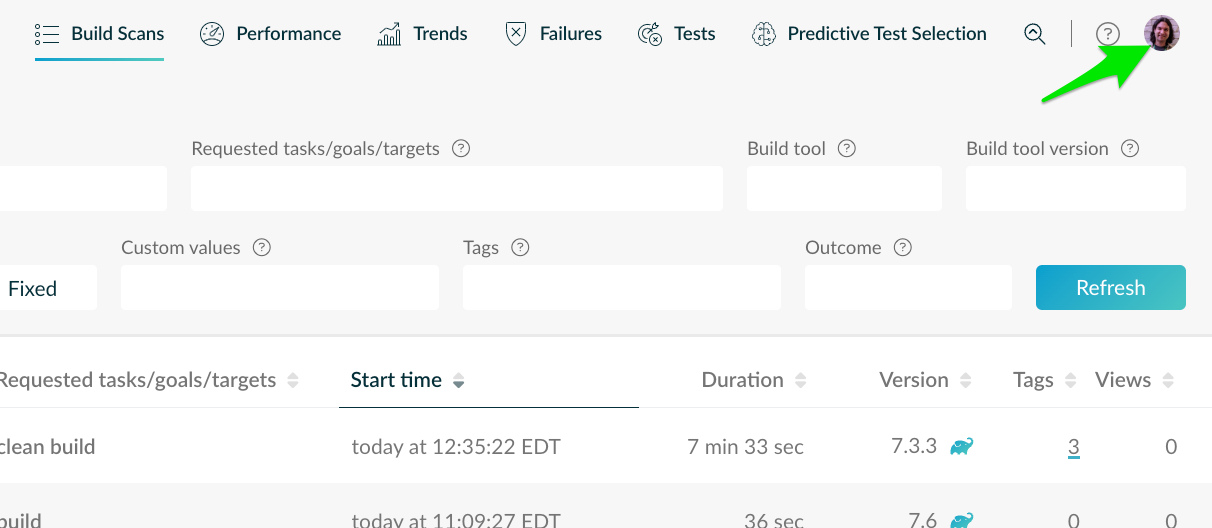
If you need to create a new key, log into Develocity and open your profile:
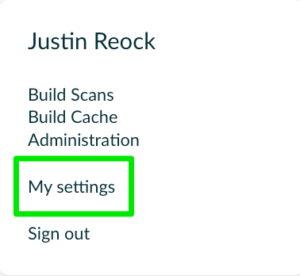
Click “My Settings,” and then Access Keys:
Open the “Access Keys” Tab on the Left, and click “Generate” to create a new key.
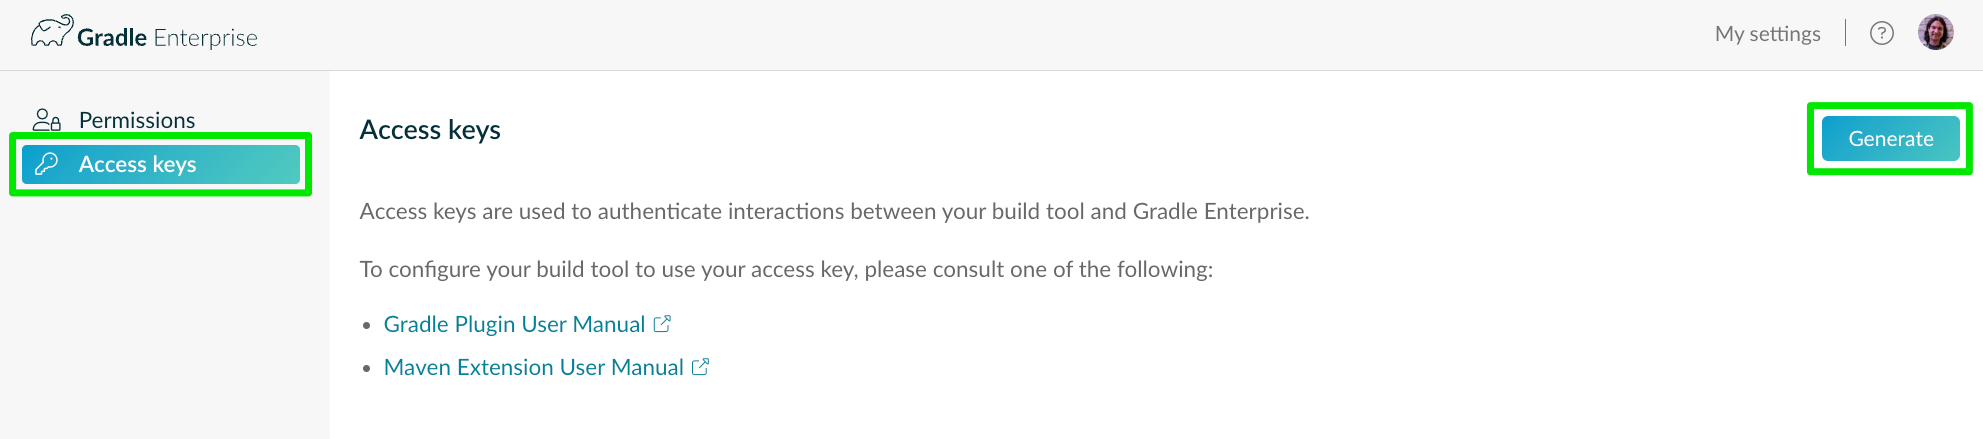
Give the Access Key a name. If there are pre-existing Access Keys, follow whatever naming convention is already in place. For instance, Access Keys could be arranged by your machine’s hostname. Accept the Terms of Service, and click “Generate.”
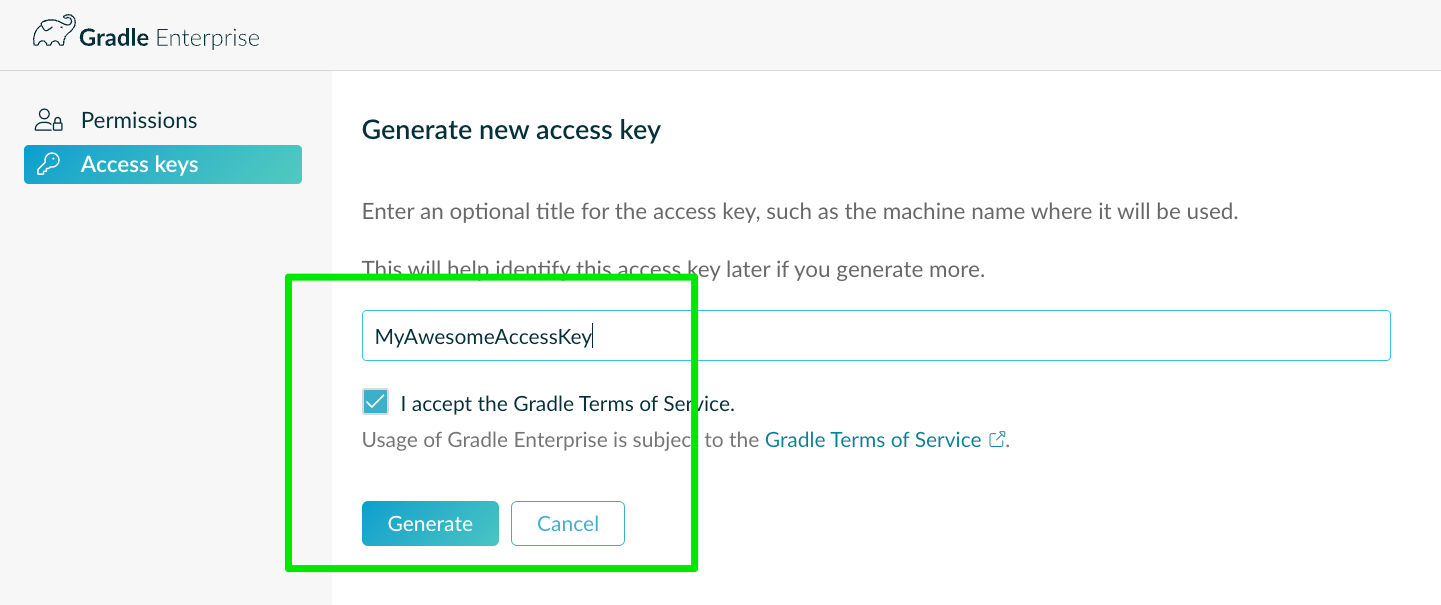
You will be presented with your access key once and only once! Be sure to copy it as you will need it to complete this exercise.
2. Retrieving Data from the REST API
You can utilize the Develocity REST API with any language capable of making REST calls to retrieve the Build Scan data. In this example, we will use Java and the java.net.http.HttpClient class to send a GET request to the Enterprise API endpoint, providing the necessary authentication and parameters.
NOTE: The API follows the OpenAPI specification, so feel free to use code generation or tooling that’s OpenAPI compliant. If you wish to use an OpenAPI code generator to generate native code for your language instead of using the REST API, you can reference the following YAML file.
At the time of writing, Develocity is on version 2023.1, so the following URL will generate an OpenAPI client against the 2023.1 specification:
https://docs.gradle.com/enterprise/api-manual/ref/gradle-enterprise-2023.1-api.yaml
As noted above, the API can query for multiple datasets. A full OpenAPI generated API documentation and always-up-to-date specification link is available here: https://docs.gradle.com/enterprise/api-manual/#reference_documentation
For this exercise, we’ll query a very important metric, build duration per-project, and we will push this metric data back into Prometheus continuously.
To connect our application to the Enterprise API, choose an HTTP Client library and create a method to connect to the Develocity URL. Again, this example will use the common java.net.http.HttpClient with a GET method request.
You’ll need to supply your Access Key from Step 1 as a Bearer token, and you will need to construct a URL.
You will construct the URL with a path according to the ‘build’ service that you wish to query, as specified in the following table. Note that this table is just a reference for services that allow for querying build data. There are other paths that can be specified for querying other data like Build Cache and Test Distribution metrics. Data can even be posted to some of these services to control certain behavior. You can view these other services via the Reference Documentation above.
Enterprise API Build Service URL Paths
| /api/builds | Query metadata about available Build Scans |
| /api/builds/[id] | Query metadata about a single Build Scan |
| /api/builds/[id]/gradle-attributes | View the Gradle-specific attributes of the build |
| /api/builds/[id]/maven-attributes | View the Maven-specific attributes of the build |
| /api/builds/[id]/gradle-build-cache-performance | Retrieve Build Cache performance statistics for Gradle builds |
| /api/builds/[id]/maven-build-cache-performance | Retrieve Build Cache performance statistics for Maven builds |
| /api/builds/[id]/gradle-projects | Show the root and subprojects of a Gradle Build |
| /api/builds/[id]/maven-modules | Show the root and subprojects of a Maven Build |
Discovering Builds
You’ll note that there are build tool-specific service paths, so, you’ll need to know the build tool used for the build that you are querying against. These are returned as part of the build metadata when querying the “/api/builds” service path.
We will start by discovering a set of builds. In our case, we will look for builds that have taken place within a certain timeslice, and run our scraper application on the same schedule. To do that, we will use the “/api/builds” service path. That service allows several different query parameters:
| fromInstant | Unix epoch time representation, will request all builds processed after that instant |
| fromBuild | Uses a Build Scan ID, will request all builds processed after that build. |
| reverse | The direction of the query. By default, this will move from oldest to newest in the timeslice (and be set to ‘false’). Setting this to true will reverse the query and list builds from newest to oldest. |
| maxBuilds | The maximum number of builds to return in the query |
| maxWaitSecs | The maximum number of seconds to wait for maxBuilds to be reached. If reached before maxBuilds, the query will return with whatever is available. |
For the purposes of this exercise, we’ll make use of the fromInstant parameter, and the application will calculate the time slice amount.
Our first URL, then, will be:
https://GRADLE_ENTERPRISE_SERVER_URL/api/builds?fromInstant=[time]
Recall our Access Key, as we will need to set an HTTP header in the request called “Authorization” with the “Bearer” representation. See the following code snippet, where you will provide your own values for the highlighted sections.
// ...

final String token = "<GRADLE ENTERPRISE ACCESS KEY>";
final String geApiUrl = "https://<GRADLE ENTERPRISE SERVER URL>";

// ...

String instantString = Long.toString(Instant.now().minus(Duration.ofSeconds(<TIME SINCE>)).toEpochMilli());
String.format("%s?fromInstant=%s", geApiUrl, instantString)
String builds = HttpUtils.procUrlRequest(discoveryUrl);

// ...

public static String procUrlRequest(String baseUrl) throws Exception {

     URI targetURI = new URI(baseUrl);
     HttpRequest httpRequest = HttpRequest.newBuilder()
           .uri(targetURI)
           .setHeader("Authorization", "Bearer " + BuildScanServiceConfig.token)
           .GET()
           .build();

     HttpClient httpClient = HttpClient.newHttpClient();
     HttpResponse<String> response = httpClient.send(httpRequest, HttpResponse.BodyHandlers.ofString());

     return response.body();

}
This code will return a JSON String similar to the following:
[
{
"id": "9r4d13f0r3v3r",
"availableAt": 1635400481000,
"buildToolType": "gradle",
"buildToolVersion": "7.2",
"buildAgentVersion": "3.7.1"
},
{
"id": "ji7vz3ey5qdvk",
"availableAt": 1635400482000,
"buildToolType": "maven",
"buildToolVersion": "3.8.4",
"buildAgentVersion": "1.13"
},
{
"id": "cvpd4j7ug7j4q",
"availableAt": 1635400483000,
"buildToolType": "bazel",
"buildToolVersion": "6.0.0",
"buildAgentVersion": "1.0"
}
]
Note that each entry contains an “id” and a “buildToolType.” This is all the data we need to start querying individual Build Scans.
Querying Individual Build Scans
Using your preferred logic structures, you can traverse the above JSON structure to query for the Build Duration for an individual Build Scan, and start pumping this data into Prometheus.
The following methods, when used together, can traverse the structure and extract Build Scan details into a HashMap of a model that represents the Build Scan data we are retrieving.
The BuildScanModel class is simple:
public class BuildScanModel {
    String projectName;
    String buildScanId;
    String buildTool;
    String buildDuration;
    String buildStartTime;

    public BuildScanModel(String buildScanId, String buildTool, JSONObject jsonBuildScanData) {

        this.buildScanId = buildScanId;
        this.buildTool = buildTool;
        this.buildDuration = Integer.toString(jsonBuildScanData.getInt("buildDuration"));
        this.buildStartTime = Long.toString(jsonBuildScanData.getLong("buildStartTime"));
        this.projectName = jsonBuildScanData.getString(this.buildTool.equals("gradle") ? "rootProjectName" : "topLevelProjectName");

    }
}
We can then populate a HashMap of that class with code similar to the following:
public HashMap<String, BuildScanModel> discoverBuilds(int timeSinceSeconds) throws Exception {

    HashMap<String, BuildScanModel> buildScanMetrics = new HashMap<String, BuildScanModel>();
    JSONArray jsonBuilds = new JSONArray(builds);  // The builds variable returned in the discovery snippet above

    for (int i = 0; i < jsonBuilds.length(); i++) {
        String buildScanId = jsonBuilds.getJSONObject(i).getString("id");
        String buildTool = jsonBuilds.getJSONObject(i).getString("buildToolType");
        buildScanMetrics.put(buildScanId, extractBuildScanDetails(buildScanId, buildTool));
    }

    return buildScanMetrics;

}
The extractBuildScanDetails method used above could be constructed as such:
public BuildScanModel extractBuildScanDetails(String buildScanId, String buildTool) throws Exception {

    String buildScanApiUrl = BuildScanServiceConfig.geApiUrl + buildScanId + "/";
    String tempUrl = buildScanApiUrl + buildTool + "-attributes";
    String tempBuildScanData = HttpUtils.procUrlRequest(tempUrl);

    JSONObject jsonBuildScanData = new JSONObject(tempBuildScanData);
    BuildScanModel myBsm = new BuildScanModel(buildScanId, buildTool, jsonBuildScanData);

    return myBsm;

 }
Observe that in the snippet above, we are using the buildTool string retrieved during the discovery query to reference either the maven-attributes or gradle-attributes service URL. Those service URLs are the ones that contain the Maven and Gradle build duration attributes that we want to push into Prometheus. The BuildScanModel class constructor will extract the necessary attributes from the JSON.
Now that we have discovered and constructed the Build Scan data we need, we can start pushing this data into Prometheus.
3. Pushing Data to Prometheus
Prometheus provides a PushGateway, which allows pushing metrics from external sources. Remember the caveat that PushGateway doesn’t allow you to override the timestamp, it is just a buffer from which it will scrape data on a regular interval.
Preparing Prometheus and the PushGateway
For our purposes, we’re just going to run Prometheus locally and install the PushGateway code. If you’re using a hosted version of Prometheus or you already have an instance elsewhere, then you can skip this step.
You’ll download your version of Prometheus from the download site. You’ll also want to download the PushGateway project from the same site:
https://prometheus.io/download/
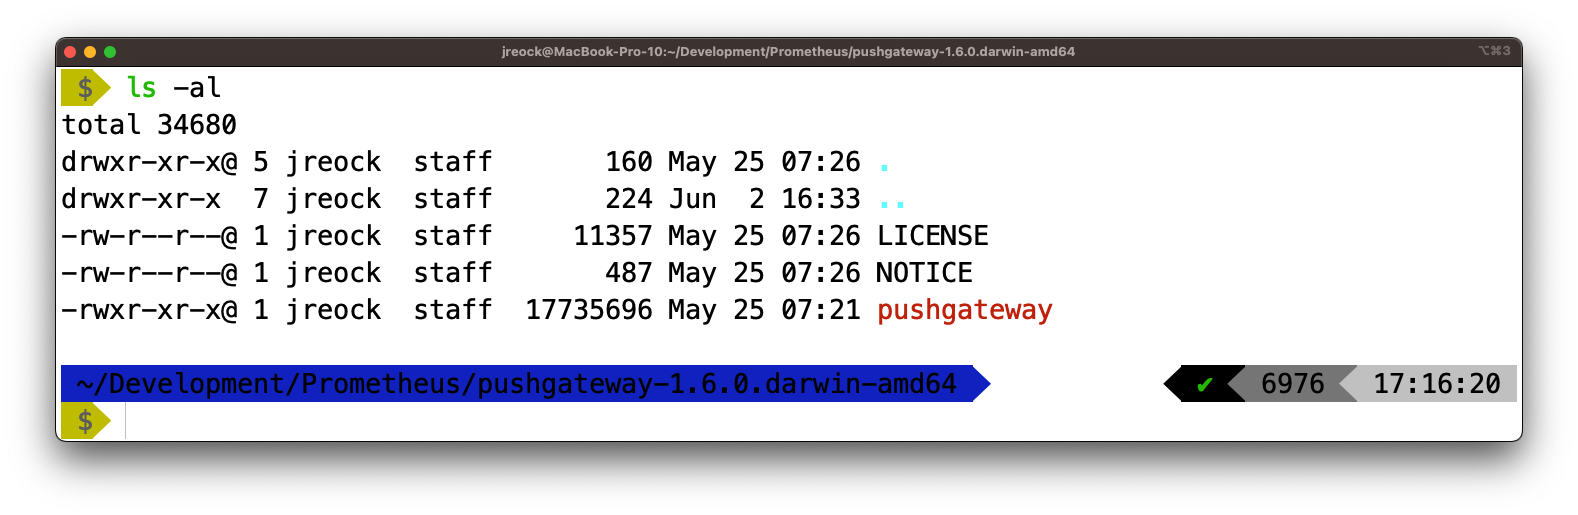
Extract the downloaded archives to two separate directories:
Prometheus
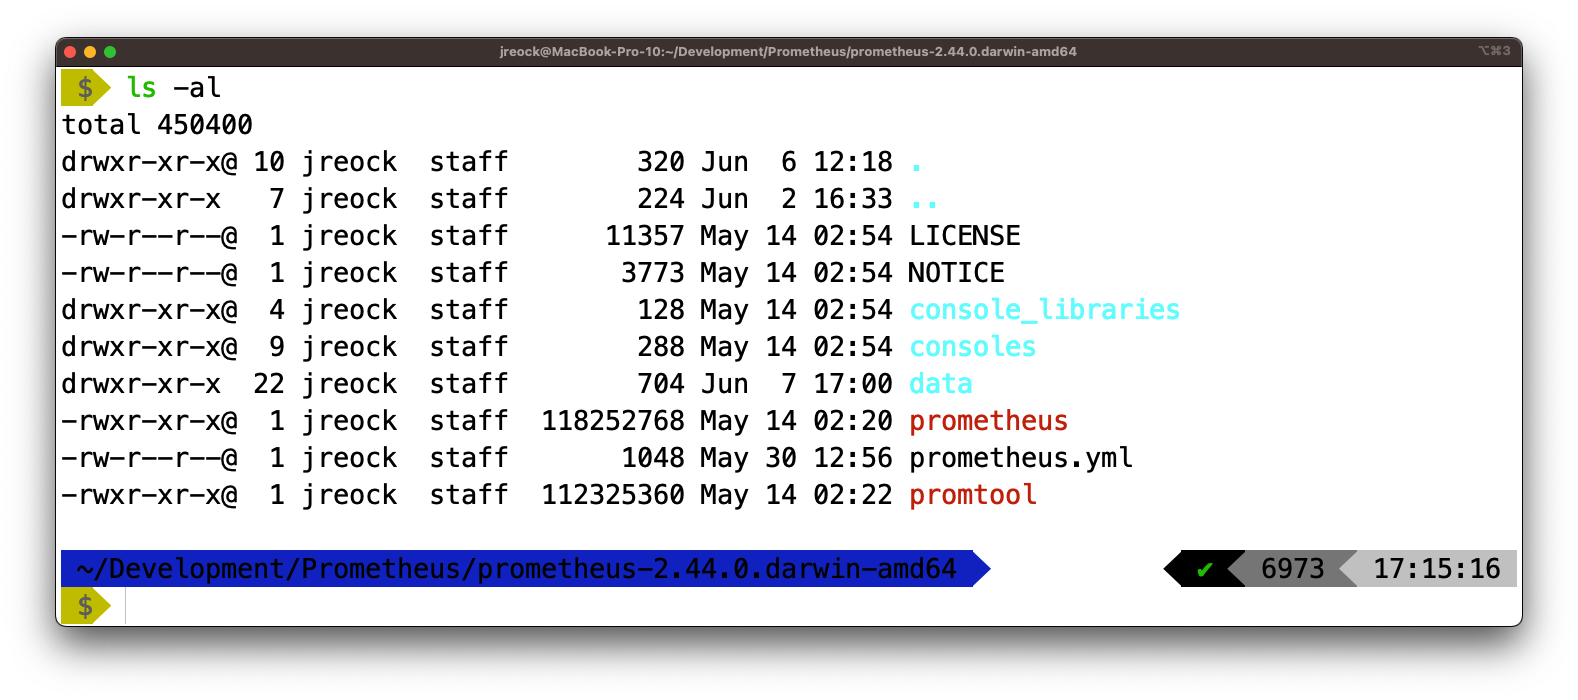 PushGateway
You will need to add the PushGateway configuration to prometheus.yml to create a job for Build Scans. You can do that by adding the following snippet to the end of prometheus.yml:
- job_name: "build_scans"

    honor_labels: true
    static_configs:
      - targets: ["localhost:9091"]
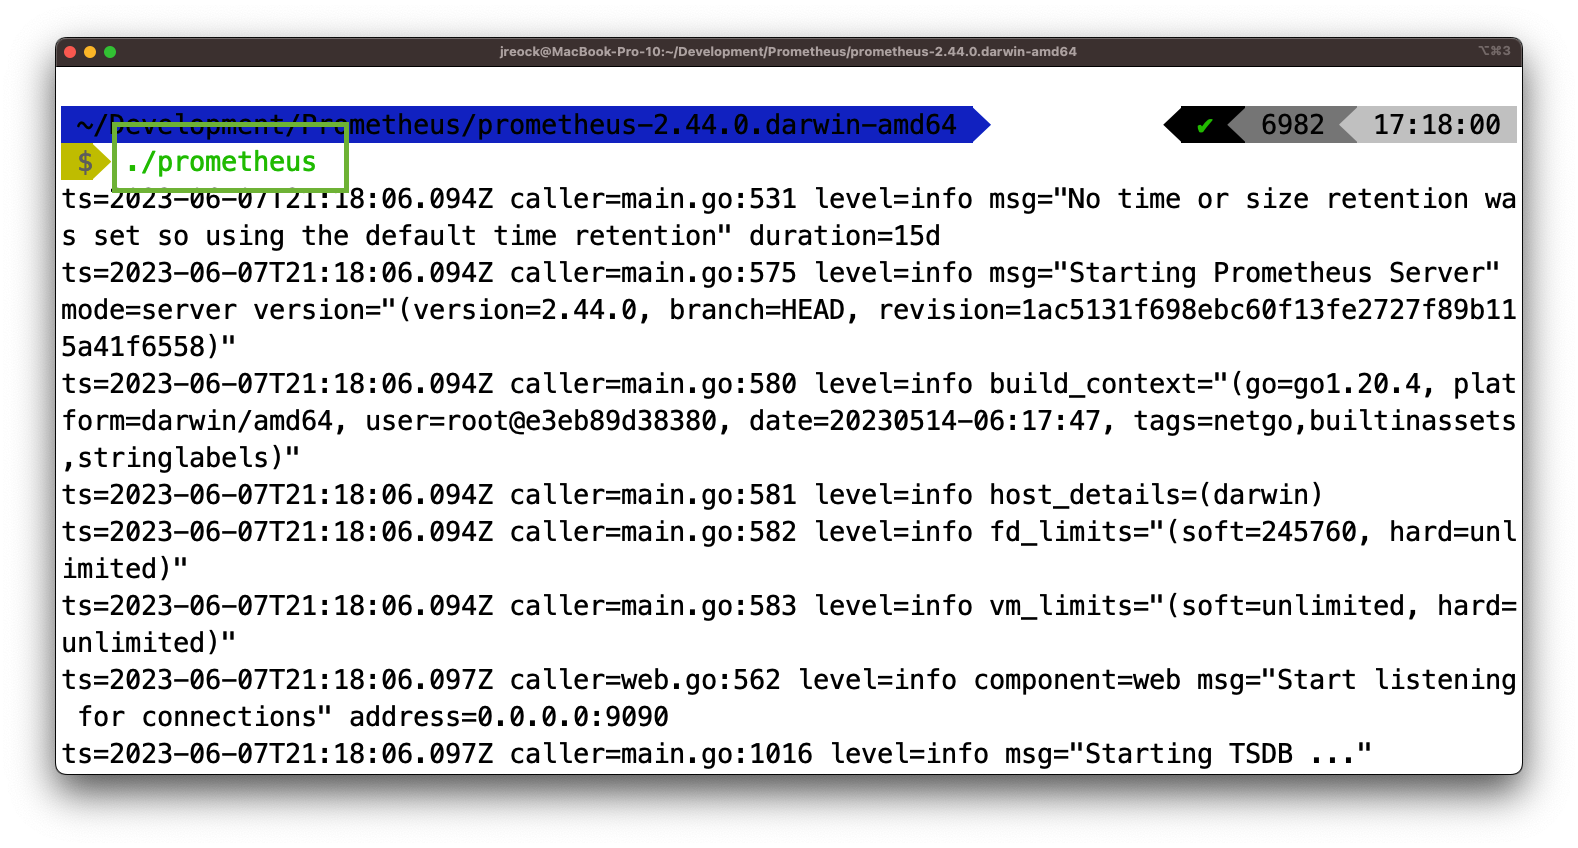
Fire up Prometheus by using the “prometheus” executable:
And fire up the pushgateway by using the “pushgateway” executable:
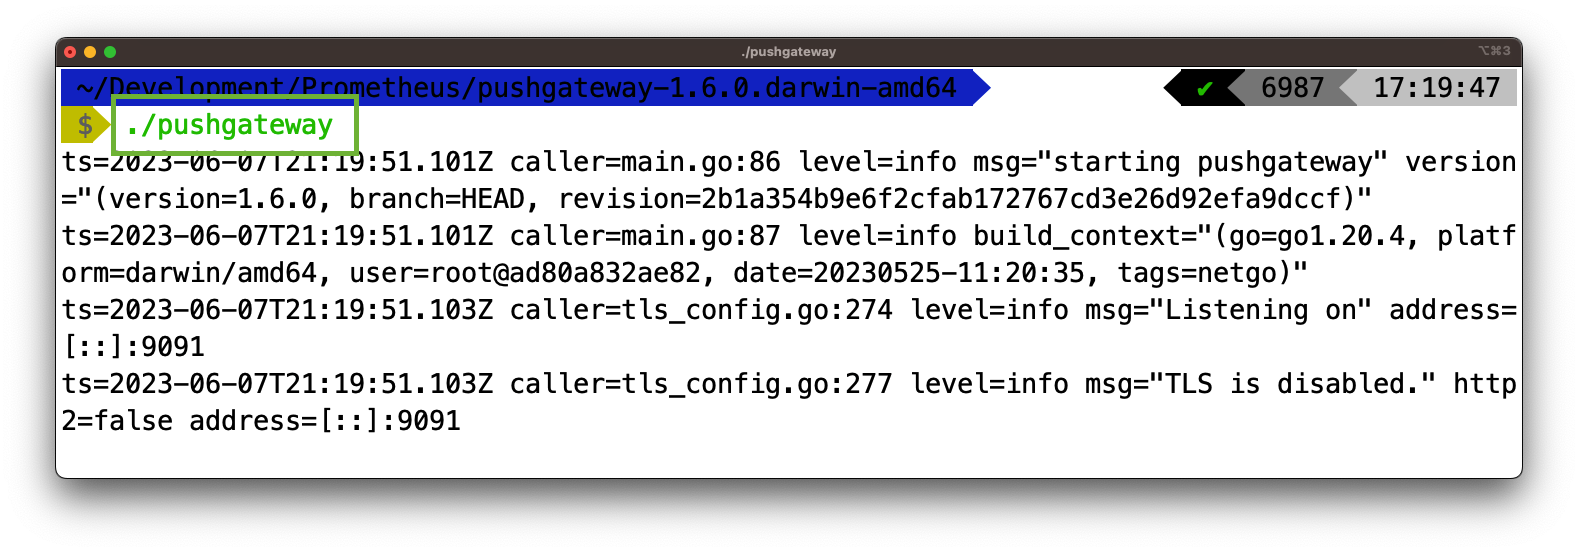
You are now ready to start pumping the Build Scan metrics into Prometheus!
Pushing Metrics Into Prometheus
Working with the Prometheus PushGateway API is very straightforward.
Add the Prometheus Java client library to your project dependencies. In the case of a Gradle build, our dependency declaration thus far will be:
dependencies {
    implementation("org.json:json:20230227")
    implementation("io.prometheus:simpleclient:0.16.0")
    implementation("io.prometheus:simpleclient_hotspot:0.16.0")
    implementation("io.prometheus:simpleclient_httpserver:0.16.0")
    implementation("io.prometheus:simpleclient_pushgateway:0.16.0")
}
You will then be able to use code similar to the following to start pushing metrics into your instance of Prometheus:
public class PrometheusUtils {

    public void pushMetrics(HashMap<String, BuildScanModel> buildScanData) throws IOException {
        final String PROMETHEUSURL = "localhost:9091";
        String prometheusGatewayUrl = PROMETHEUSURL;

        // Traverse the Builds
        int i = 0;
        for (BuildScanModel bsm : buildScanData.values()) {

            CollectorRegistry registry = new CollectorRegistry();
            String buildId = buildScanData.keySet().toArray()[i++].toString();

            // Create a gauge metric
            Gauge buildDurationMetric = Gauge.build()
                    .name("build_duration_" + bsm.projectName.replace("-","_"))
                    .help("Duration of the build")
                    .register(registry);
            buildDurationMetric.set(Double.parseDouble(bsm.buildDuration));

            // Push metrics to Prometheus

            PushGateway pushGateway = new PushGateway(prometheusGatewayUrl);
            pushGateway.pushAdd(registry, "build_scans");

        }
    }
}
There are a few things happening here of which to be aware. Note that we are creating a Gauge metric. This is one of a small set of metric types that are provided by the PushGateway API. In our case, we are providing a metric over time, which Gauge is set up to handle.
We are also naming this metric “build_duration_[Project Name]” where Project Name corresponds to the name of the project retrieved during the discovery. This is so that we can store the duration against the last instance of a build per-project, as opposed to just all builds for every project, which wouldn’t be very useful for looking at trends.
Once we have this method written, we can simply provide the HashMap of BuildScanModels that we created in the previous section to the pushMetrics() method that we have created here.
public static void main(String[] var0) throws Exception {

    HashMap<String, BuildScanModel> buildScanMetrics = new BuildScanExtractor().discoverBuilds(900);
    new PrometheusUtils().pushMetrics(buildScanMetrics);

}
We now have a mechanism to scrape the API once and discover builds within a specific time period. Note that I have specified 900 seconds, or 15 minutes, as an input to the discoverBuilds method of a class called BuildScanExtractor. In my example, BuildScanExtractor contains the methods that we defined in the ‘Querying Individual Build Scans’ section above, and discoverBuilds runs the first API call we make to “/api/builds.”
Reference the GitHub project included above for a full code example.
Run the application and you should be able to query metrics in the Prometheus environment. With the default configuration, you can access that in a browser using http://localhost:9090. Otherwise use the Prometheus dashboard URL visible in Prometheus’s startup output.
Enter the query {__name__ =~ “build_duration.*} in the Search bar and you should see per-project durations showing up, if any builds have been created during the time the project has been running:
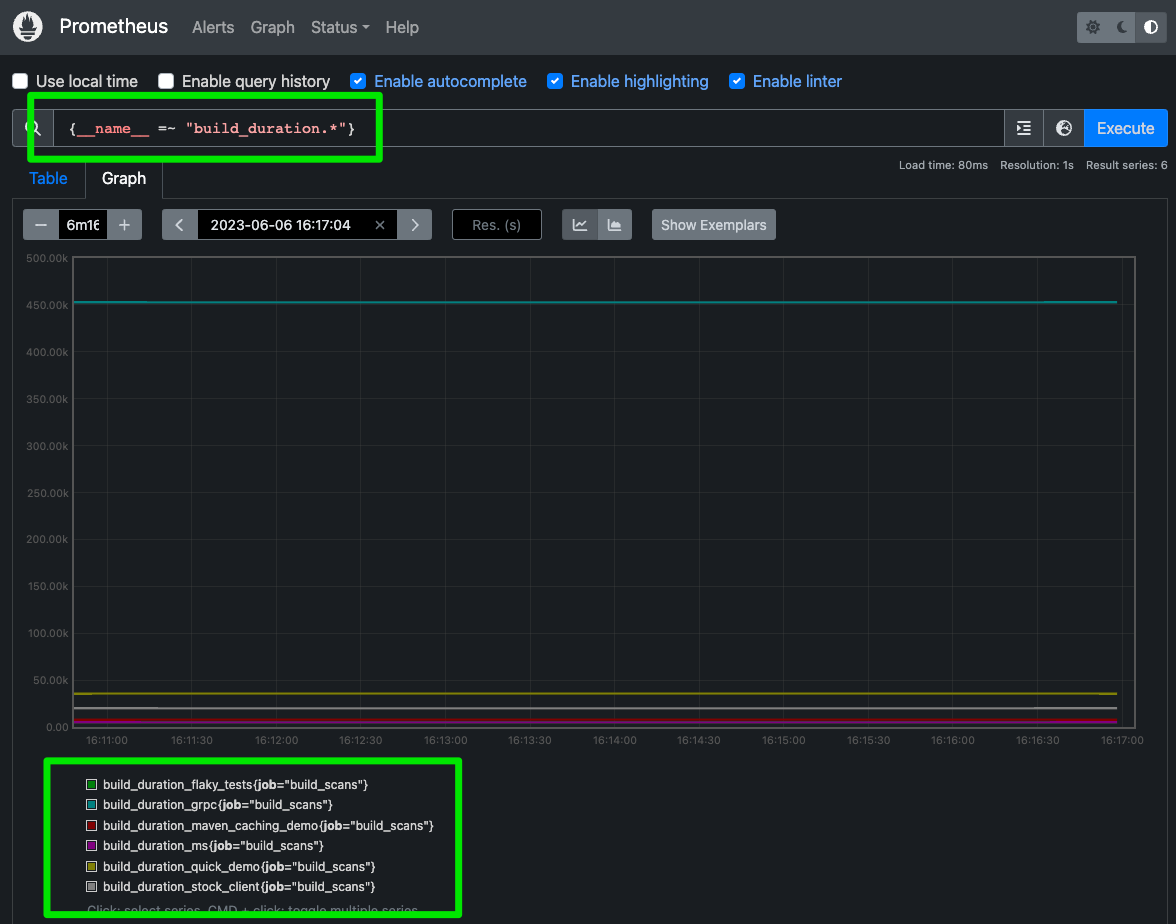
Don’t worry about the axis values. We will be using Grafana and not Prometheus for the visualization layer.,. We now need to automate the process of pushing these metrics into Prometheus to keep a running history of the last build duration per-project. Then we’ll move on to configuring Grafana.
Automating the Process
To continually extract and push Build Scan data to Prometheus, you can integrate the code into a scheduler or a CI/CD pipeline. You could trigger this to scrape on every build. Note that the Export API does provide a publish/subscribe mechanism which lets you listen for builds as they come in, but that API is scheduled to be deprecated.
You can also schedule the script to run periodically, triggering the data extraction and pushing process. You could do this via cron or some other scheduling mechanism, just be sure to align the schedule with the time slice that you’ve specified above.
For this example, I’m capturing builds on a 15 minute basis and I’m using a distribution built by Gradle, so my cron entry will look like this:
*/15 * * * * /opt/BuildScanExtractor/bin/BuildScanExtractor
This is where the caveat mentioned in the beginning of this blog becomes relevant. Because Prometheus is meant to scrape data in real time, if multiple builds of the same project are run within the timeslice, the PushGateway will only write the last duration it received; it will not write different values for all builds.
If you need more granularity, reduce the time slice and set your scheduler accordingly. Prometheus is very robust, so you can reduce this down to the seconds if you are running builds very frequently.
Now that we have data automatically being added to Prometheus on a regular basis, let’s finish this exercise by setting up visualization of build durations in Grafana.
4. Visualizing Prometheus Data with Grafana
We’re almost there! We need to set up Grafana and configure it to query our Prometheus instance.
Setting Up Grafana
Install and set up Grafana on your system or use a hosted Grafana service. In this case, we’ll install it locally alongside our instance of Prometheus. Grab the latest version from the download site and extract it: https://grafana.com/grafana/download?pg=get&plcmt=selfmanaged-box1-cta1
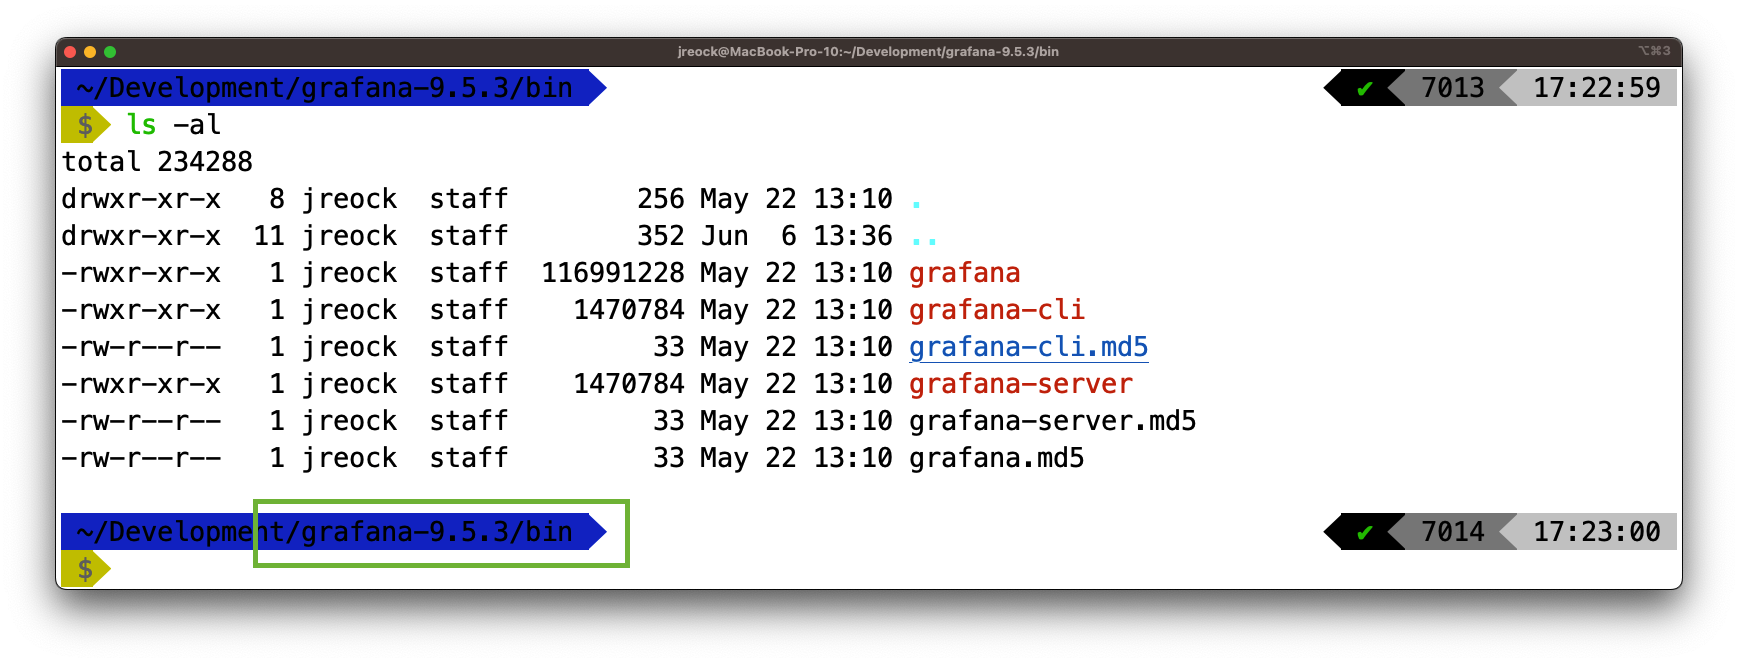
Most of Grafana’s configuration is done via the web interface, so just fire it up with the ./bin/grafana-server executable:
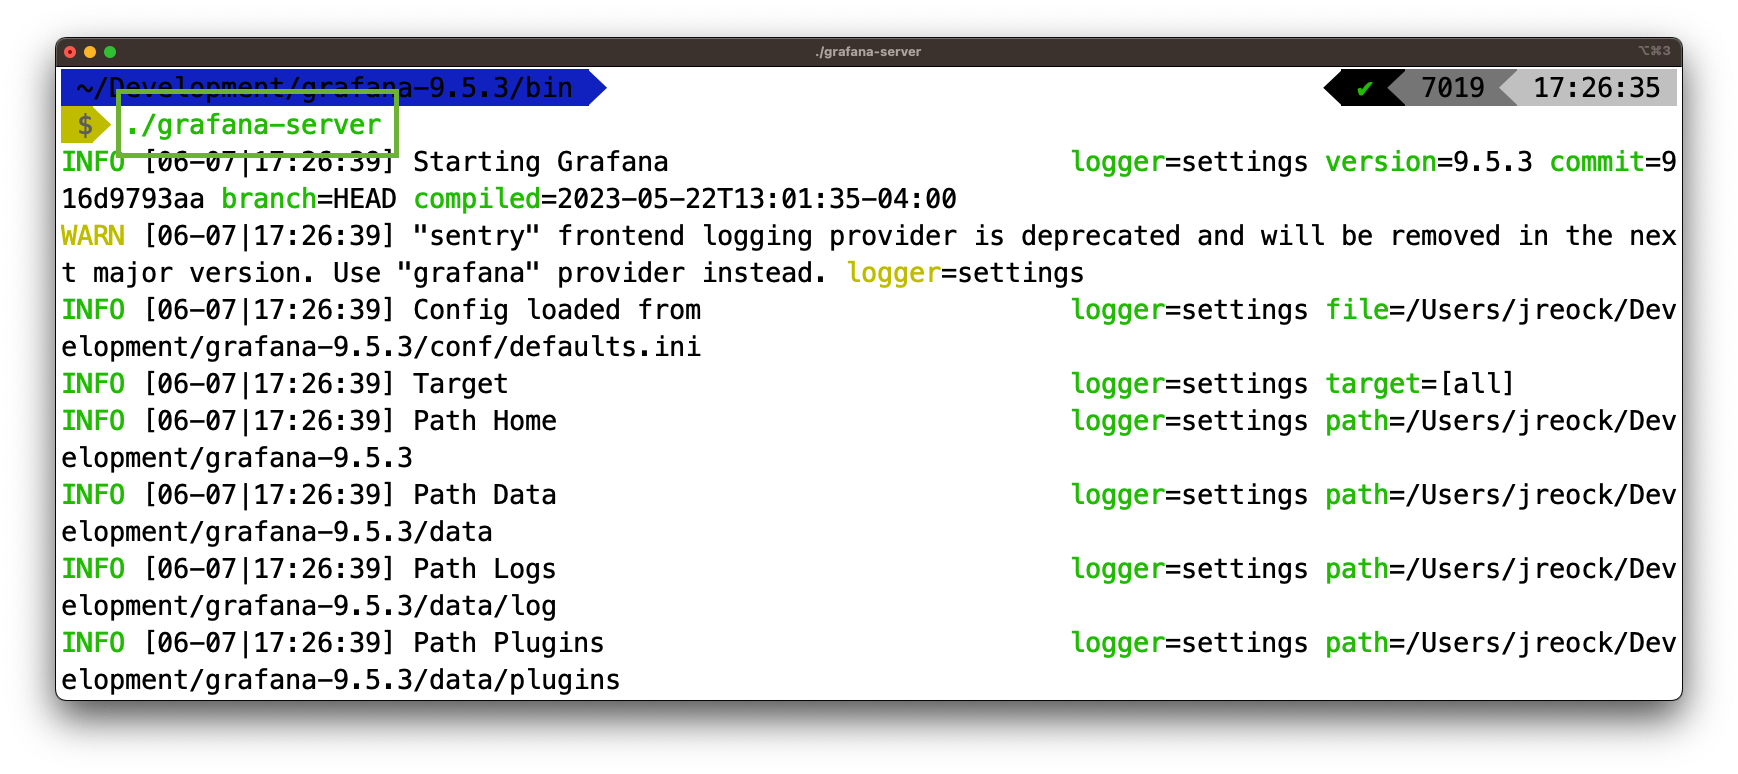
By default, you can access the Grafana dashboard via port 3000: http://localhost:3000.
You will be prompted for a username and password, which is “admin/admin” by default. You will also be prompted to change that password. You will then need to configure Grafana to query your instance of Prometheus.
Configuring Prometheus as a Data Source in Grafana
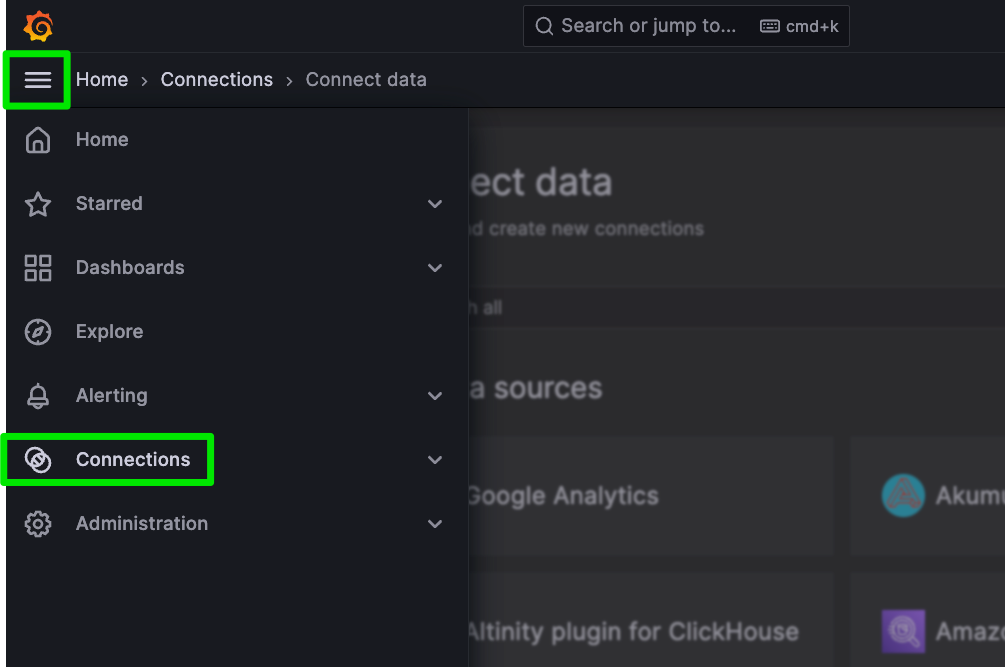
In the Grafana UI, open the Side Panel menu and click Connections …
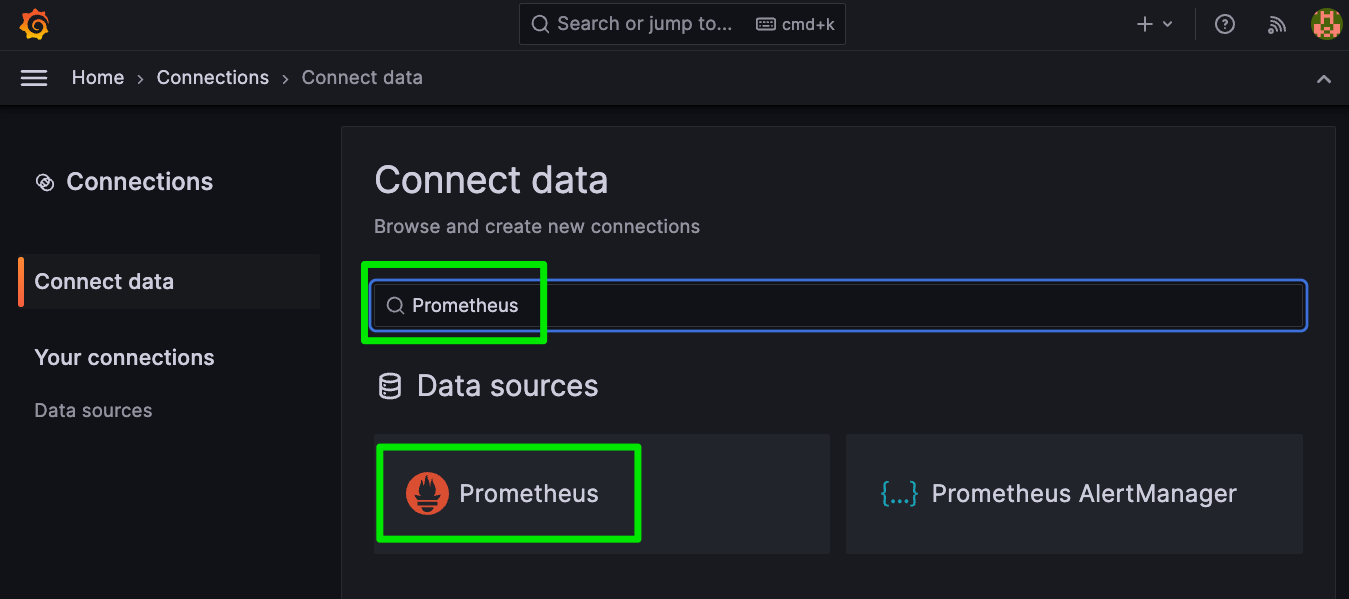
Find and select Prometheus as the Connection:
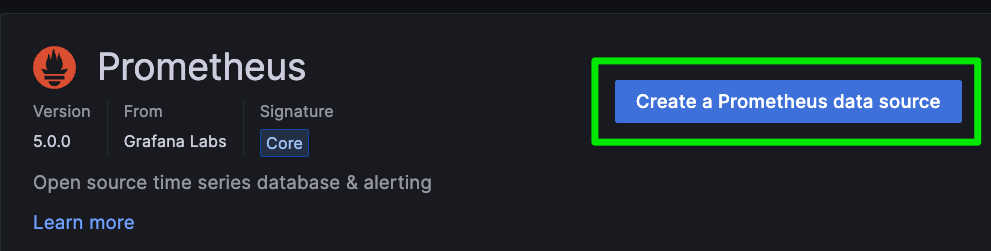
Choose to create a new Prometheus data source:
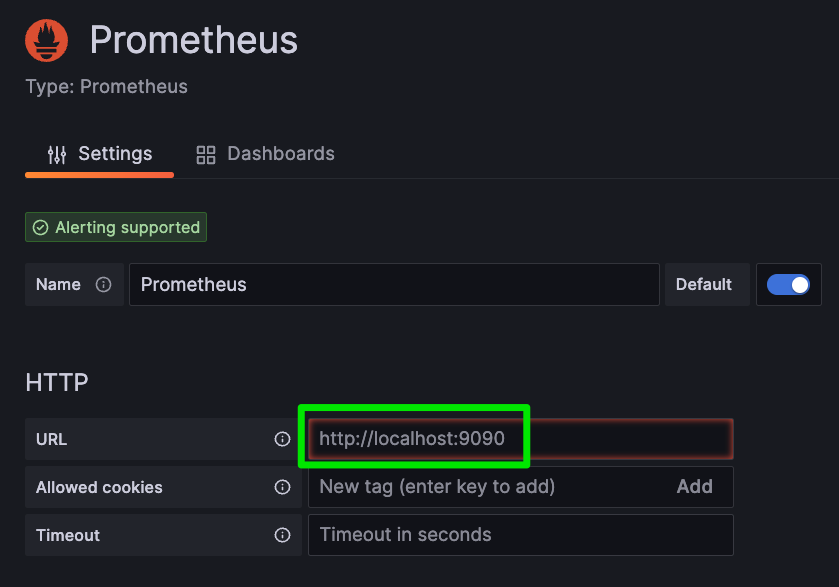
The defaults should be fine for our exercise, but you can change the Prometheus URL here if you are not running it locally. If you are running it locally, you will still have to enter http://localhost:9090, as the pre-populated value is a grayed-out example and not an actual value.
Scroll down and click “Save & Test.” If everything goes as planned, you should see an indication that the data source is working. Now we can create a dashboard.

Creating a Dashboard
Open the Side Panel menu and Click on Dashboards…
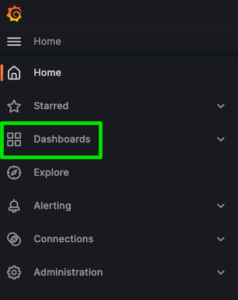
And click on New -> New Dashboard:
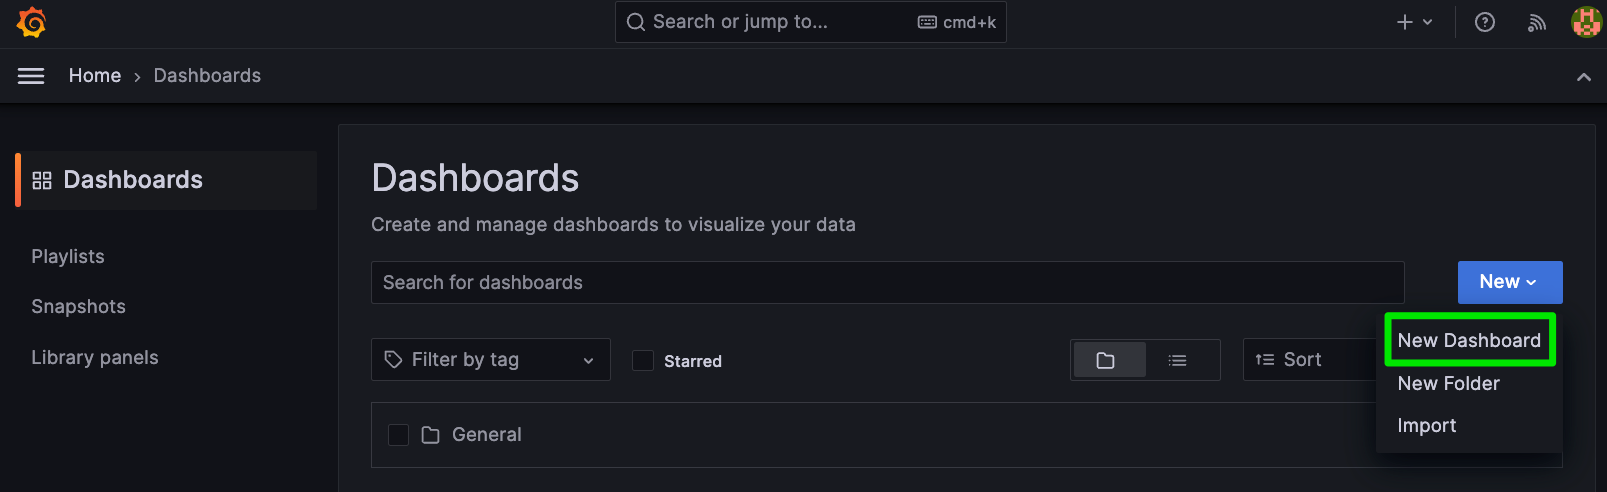
You’ll be presented with some starting points. I like to save the dashboard and give it a name at this point:
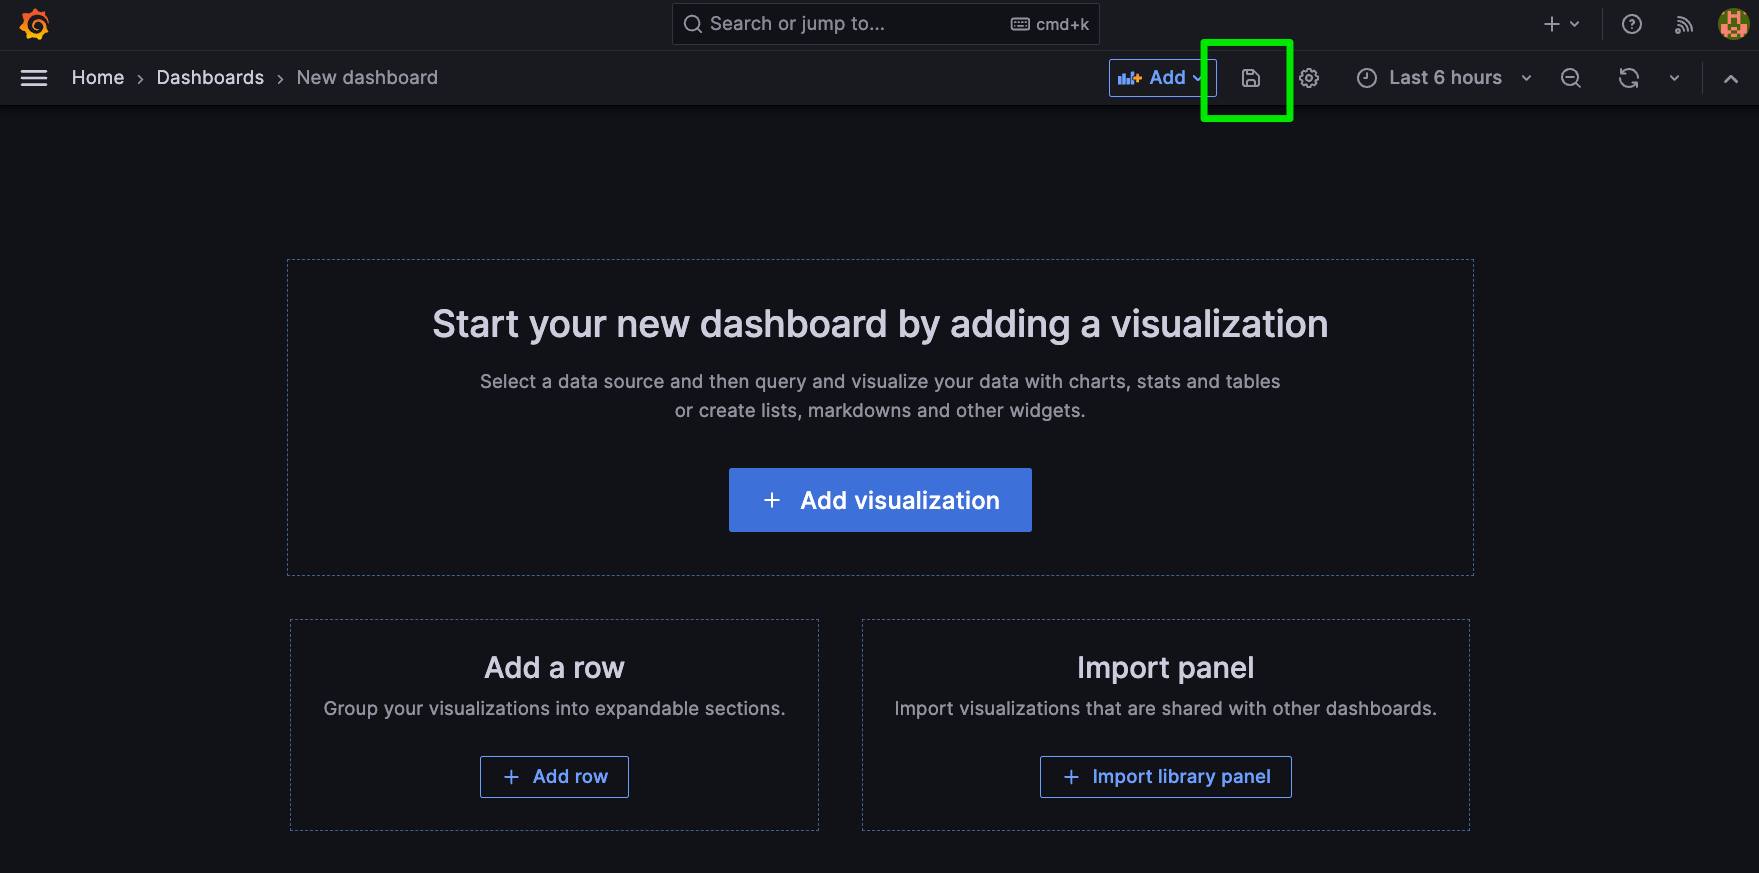
Once we have named our dashboard, we can start adding visualizations to it.
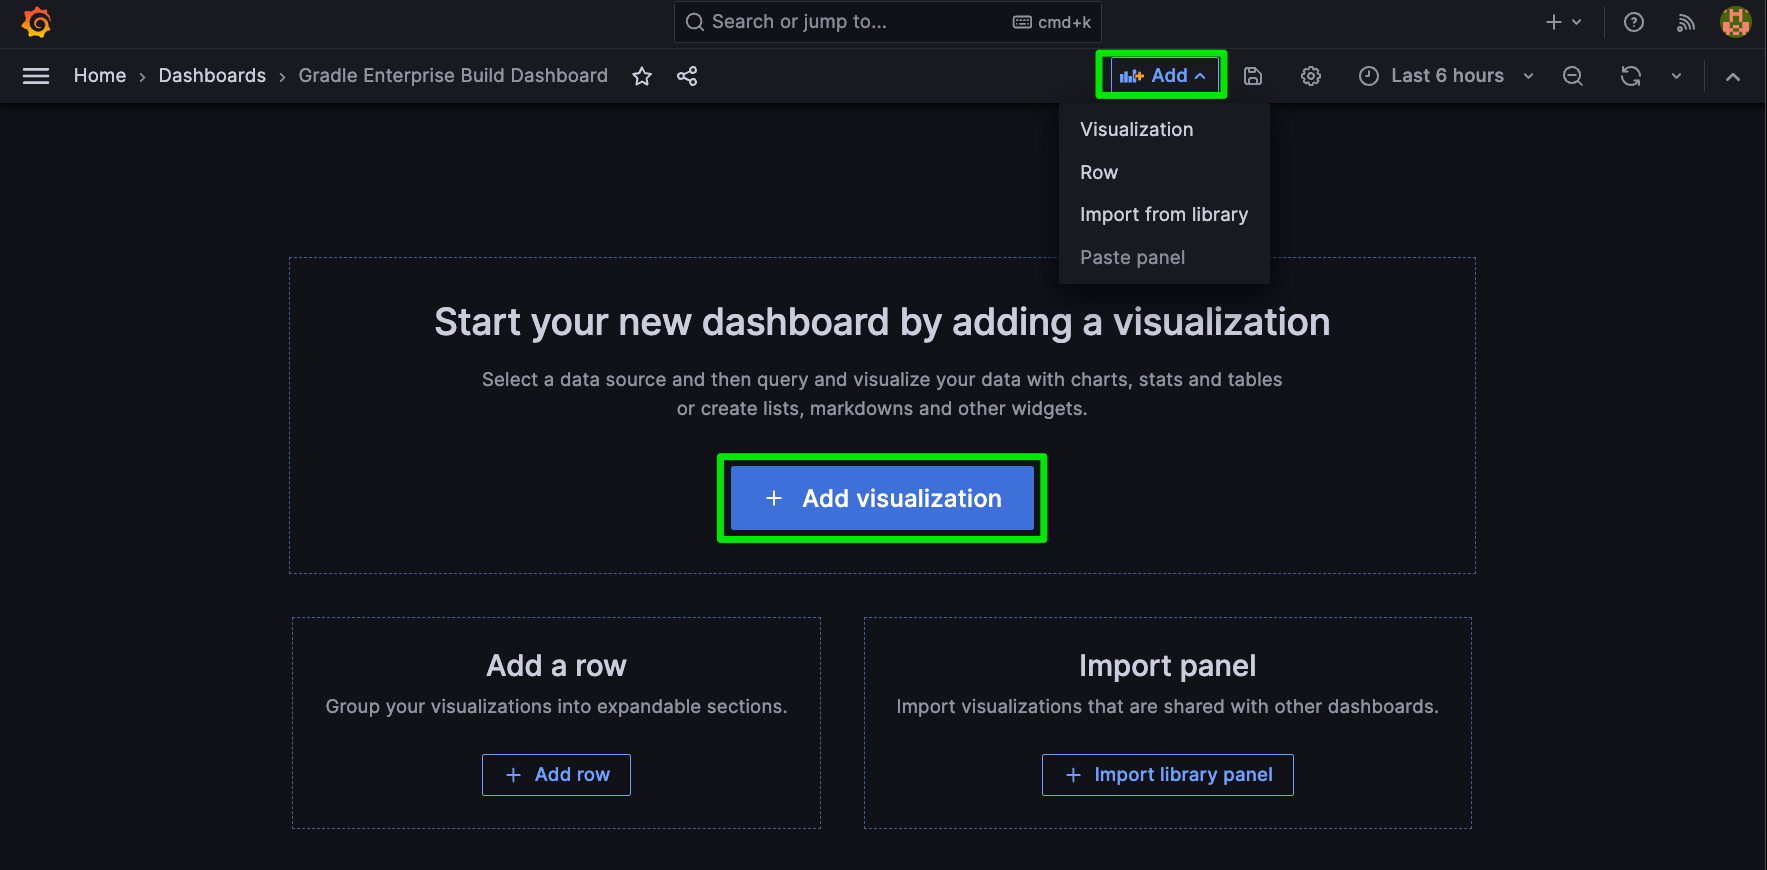
Adding Visualizations to the Dashboard
You can use the big blue button that says + Add visualization, but once you’ve started your dashboard, that will disappear. Note the small +Add button on the upper right. Going forward you can add additional visualizations this way.
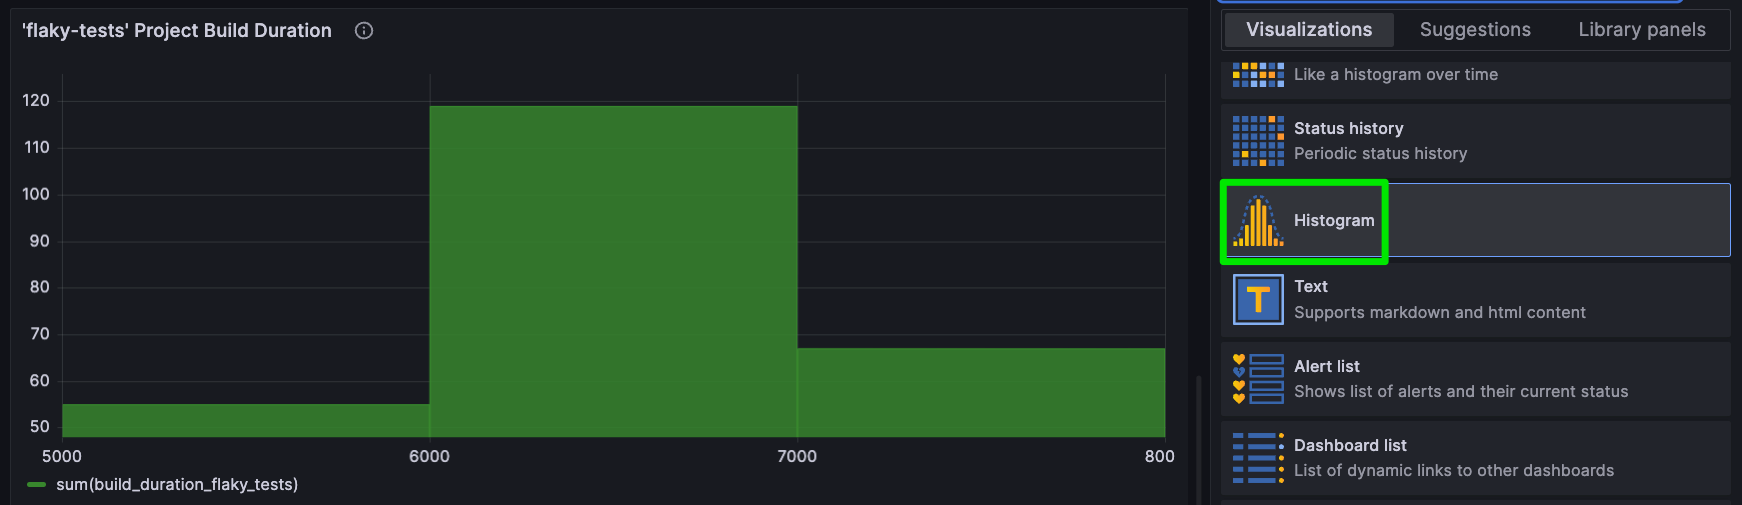
We’ll start by creating a histogram for one of the projects that are building against the GE server. We can see which projects have been building actively by looking at the Develocity Build Scan page, and we can create histograms for each project since we included the project name in the title of the Prometheus Gauge metric we created above.
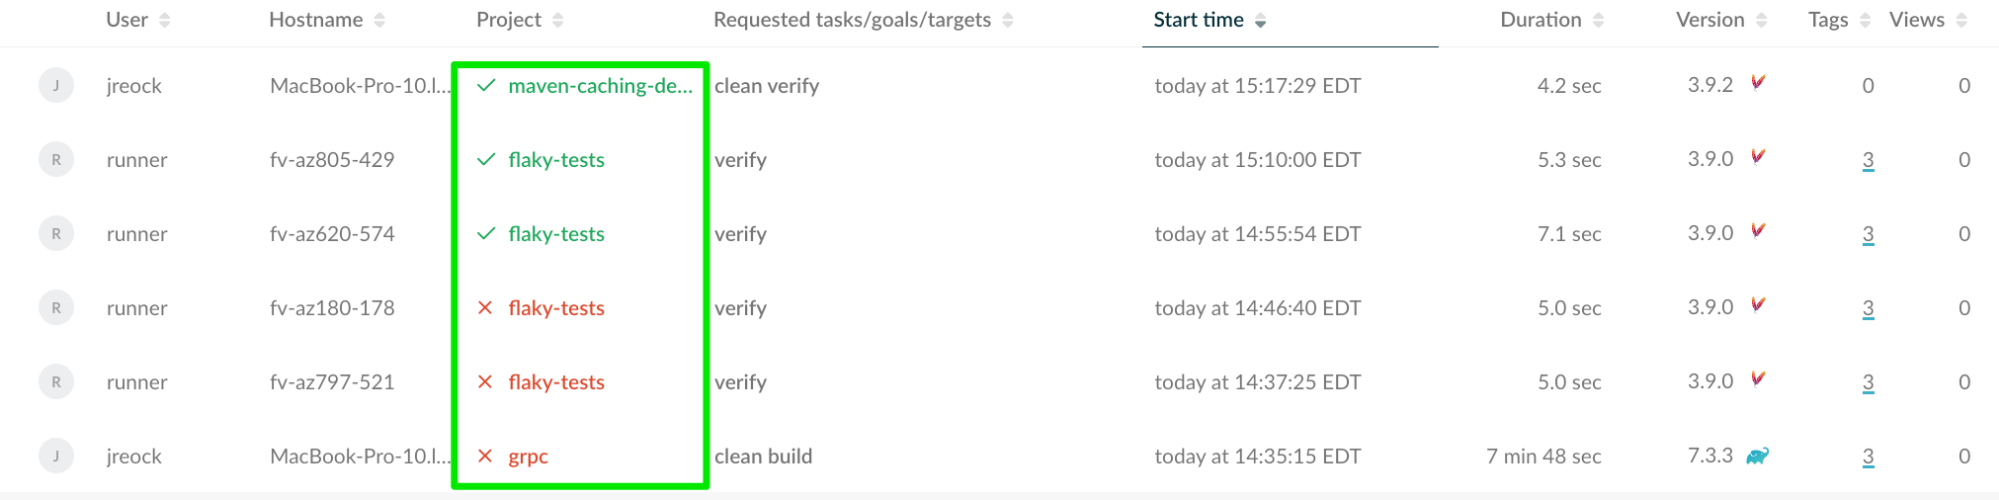
Let’s create a visualization for the ‘flaky-tests’ project. Since our naming convention was to name these metrics individually against a single project, we should have a metric called build_duration_flaky_tests. We validated that in the Prometheus query we executed above. This applies to the other projects, so we should also have build_duration_maven_caching_demo and build_duration_grpc.
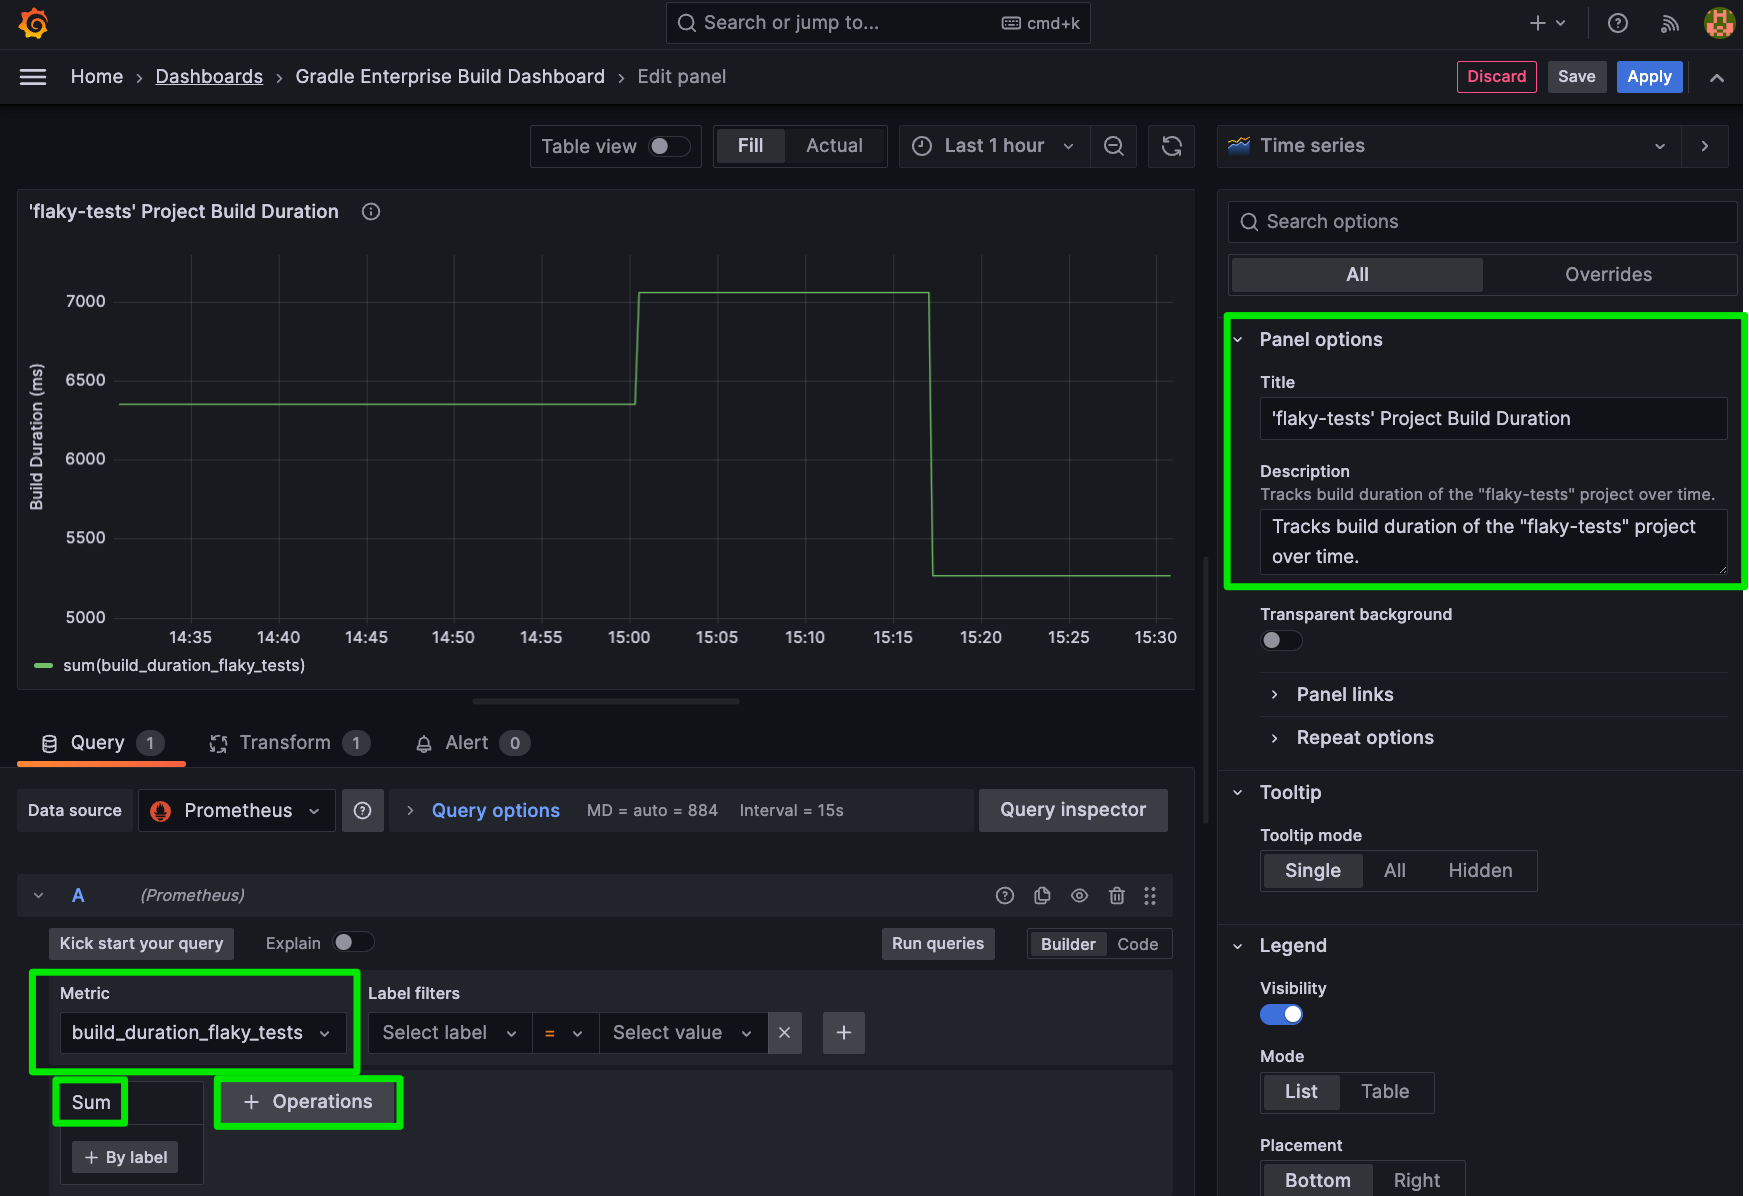
When we open the visualization pane, there’s quite a bit going on. As indicated in the image below, we will be giving our Dashboard a Title and Description, selecting our metric under the query menu, choosing the “sum” operation under +Operations -> Aggregations -> Sum since we’re just looking at a static number, and tweaking the look and feel.
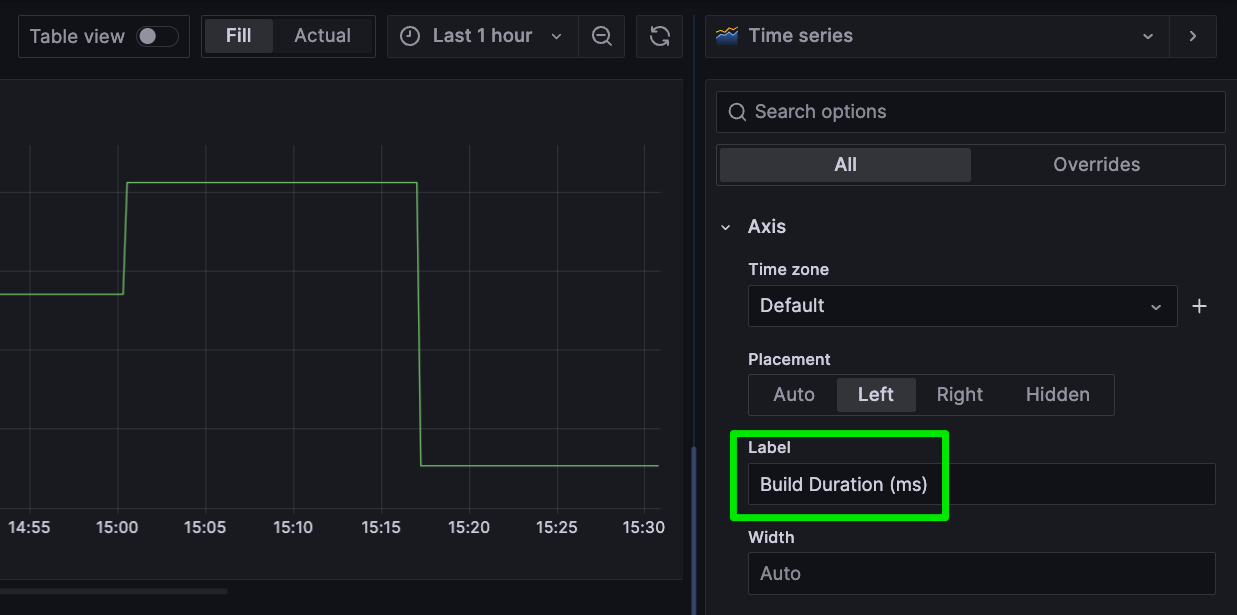
You can change the X label by scrolling down on the right hand window and updating the Axis -> Label value:
You can also choose different graph formats in the menu that says “Time Series”…
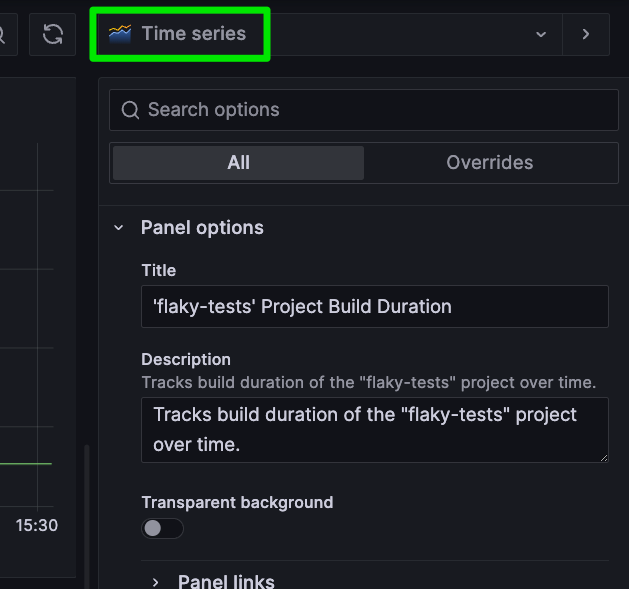
Choose a new format and the visualization will respond:
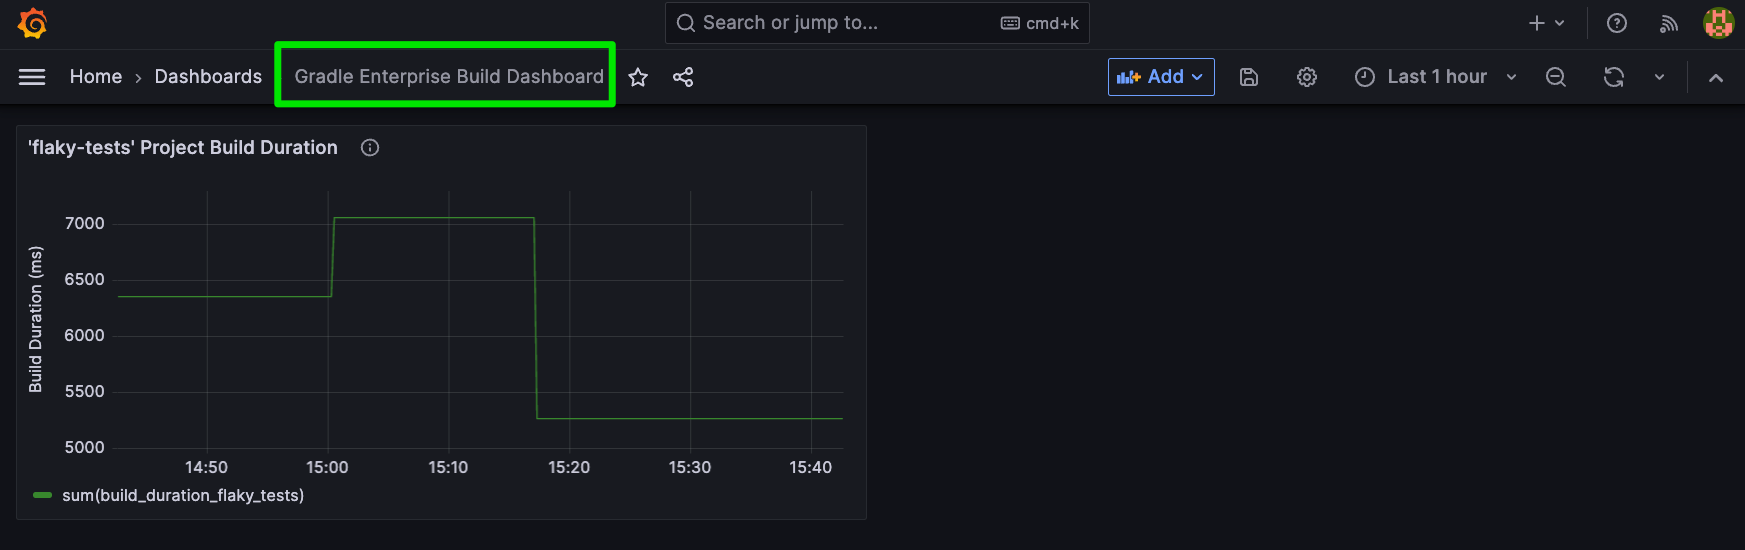
Once you are satisfied, hit the Gray “Save” button on the upper right. You’ll be prompted to enter some notes about the change. Then return to the Develocity Build Dashboard. Your new visualization will now be included!
You can use the “+Add” button to add other visualizations and queries. Visualizations can be dragged and dropped around the canvas, and Rows can be added to provide better organization by Selecting “+Add” -> Row.
In this case, we’ll add the same queries for the other two projects being tracked:
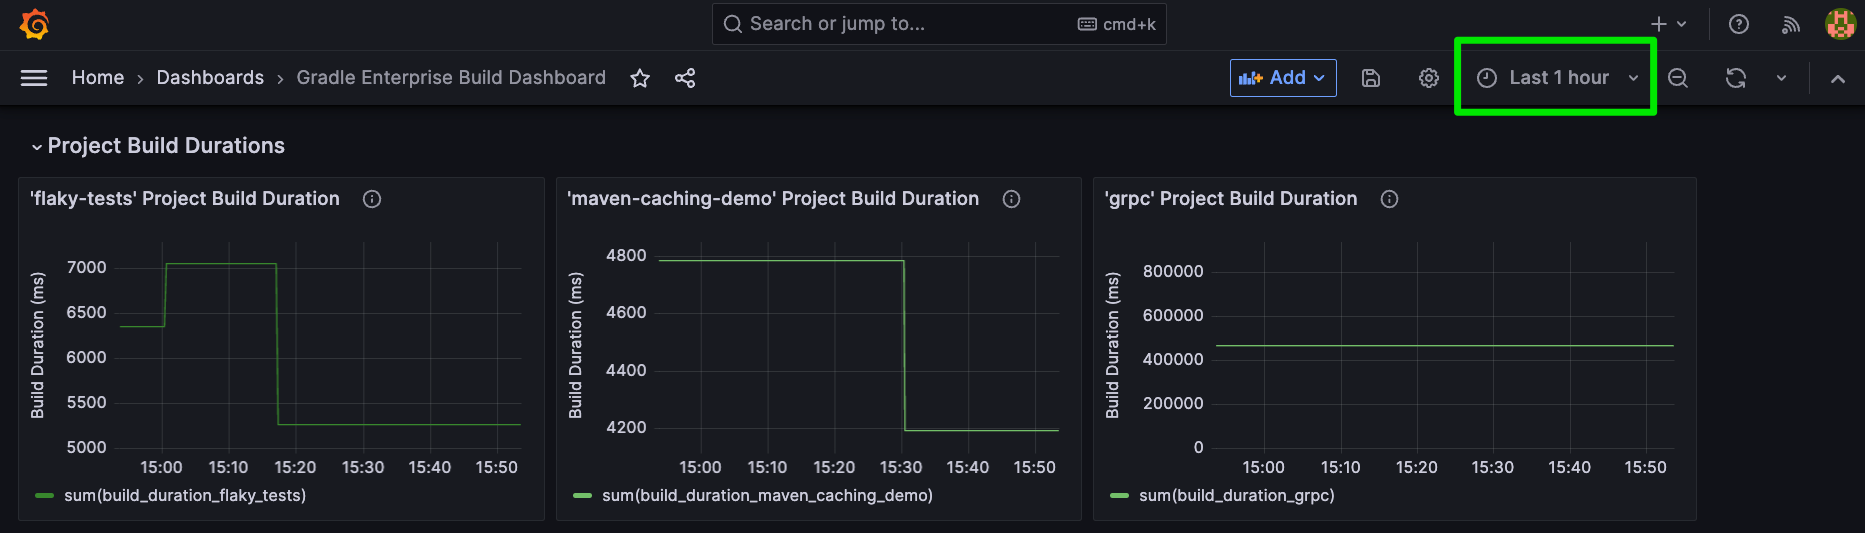
You can adjust the time range by clicking on the range button on the upper right, and you can continue to explore and customize the many options Grafana gives you. Truly beautiful dashboards can be created using only Grafana raw components.
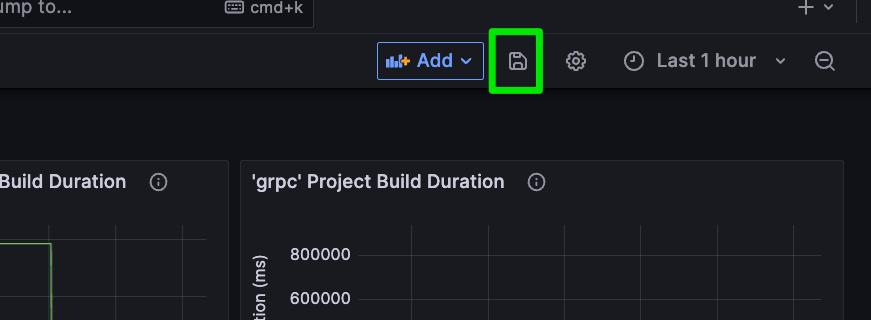
Saving and Sharing the Dashboard
Once you have configured the panels and customized the dashboard to your liking, save it in Grafana. You can share the dashboard with your team or embed it in other applications for easy access to the Build Scan metrics.
Wrapping Up
By integrating Develocity, Prometheus, and Grafana, you can establish a single monitoring and visualization source for basic Developer Productivity Engineering metrics. Although replicating the full visual power of Develocity would be nearly impossible, it is often very valuable to pull critical metrics such as Build Duration into another dashboard.
There’s a lot more to do here. We’ve only captured one metric and scratched the surface of what Grafana can do. And yet you have everything you need to keep experimenting on your own. Explore the additional metrics that are available in the Develocity API documentation. See what more is possible with Grafana by exploring the interface and reading the Grafana documentation. Even think about better ways we could pipeline the data into Prometheus, including CI triggers and other more accurate methods.
Bottom line: The Enterprise API gives us a powerful, OpenAPI-standards-driven approach to retrieving data from Develocity. This makes it easy to centralize DPE metrics and display them alongside other data sets.