Do you ever watch your IDE sync or build run and think to yourself: “This is slow. I think this used to be much faster”? I do, more often than I’d like to admit.
Build times degrade without insights into how much or why—nearly always unintentionally and often unnoticed until there is a lot of wasted time and money.
To monitor and improve build time for a collection of builds, you need to analyze the range of performance metrics in a time series. This differs from visualizing builds individually and seeking outliers using the Develocity performance dashboard.
Starting with Develocity 2019.2, we are making build trends available.
This dashboard tells you what proportion of your Gradle or Maven builds are getting slower or faster over time, and indicates the major contributing factors to that change: initialization time, costs of build cache misses or non-cacheable work, and so on.
How to use build performance trend visualizations
I’m going to demonstrate Build Trends by taking an example from Gradle build tool development.
First some context: we want Gradle engineers to get changes on master as quickly as possible. At Gradle, nothing gets on master unless it passes an extensive performance test suite, among other things. Performance tests run all the time; it’s important that we know when they slow down.
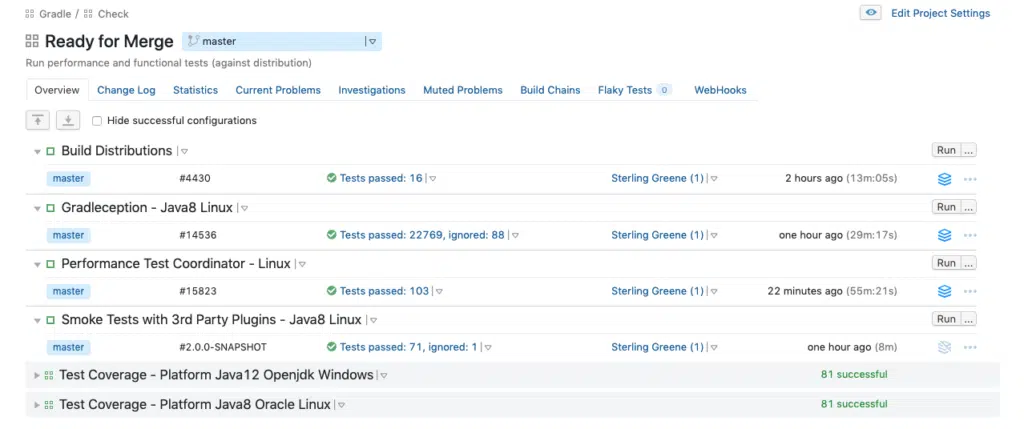
Every CI build generates a build scan (with a `CI` tag), so digging a bit I can quickly determine that the costliest task here is :performance:distributedPerformanceTest. First, I search for scans matching these criteria.
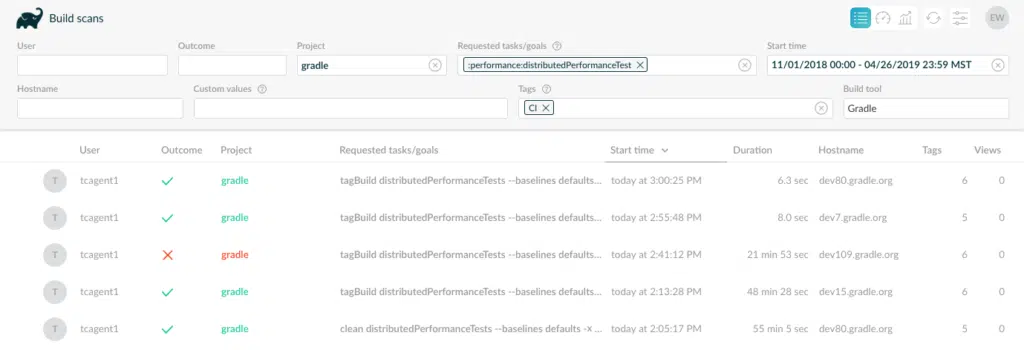
I then click the Trends button ![]() and set the time granularity to “Week” or “Month” to filter out the noise of daily ups and downs.
and set the time granularity to “Week” or “Month” to filter out the noise of daily ups and downs.
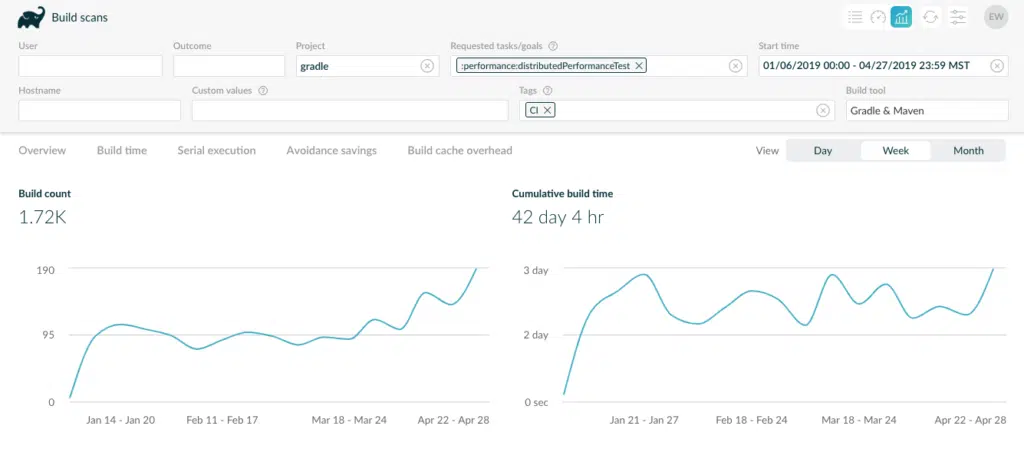
You can see that 1700 builds (and climbing) have been executed taking over 42 days of serial execution time.
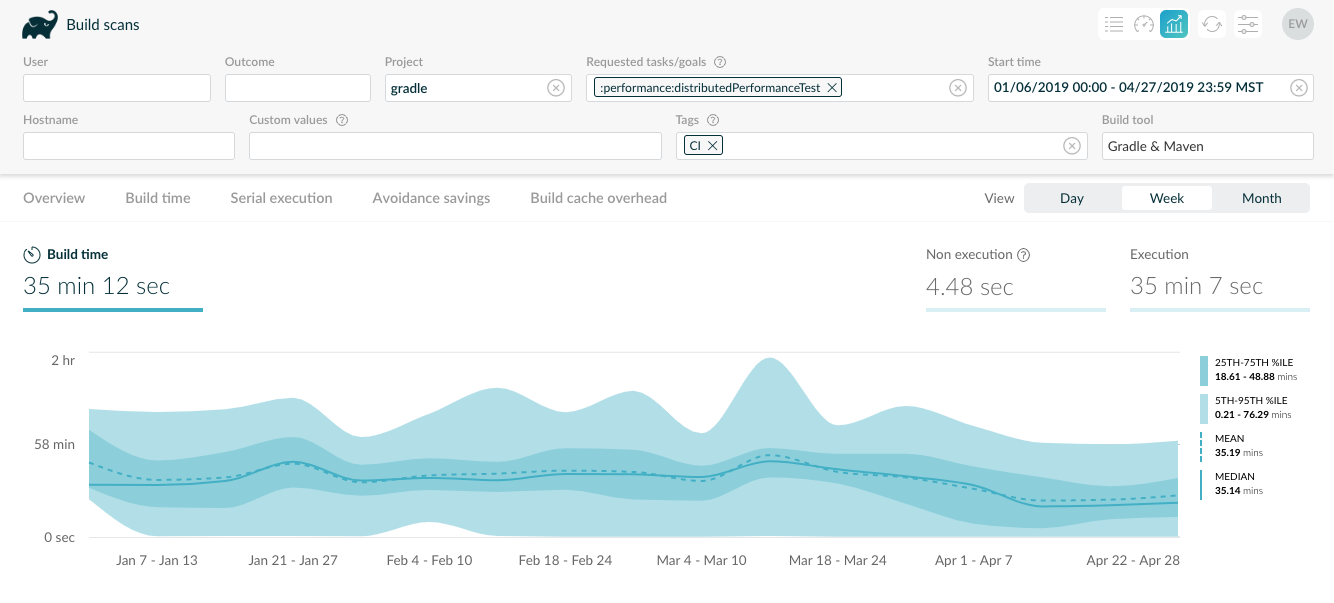
Scrolling down, we see that 90% of builds are between 0 and 78 minutes, and most are between 18 and 48 minutes. We also see a significant dip in the median build time at the beginning of April.
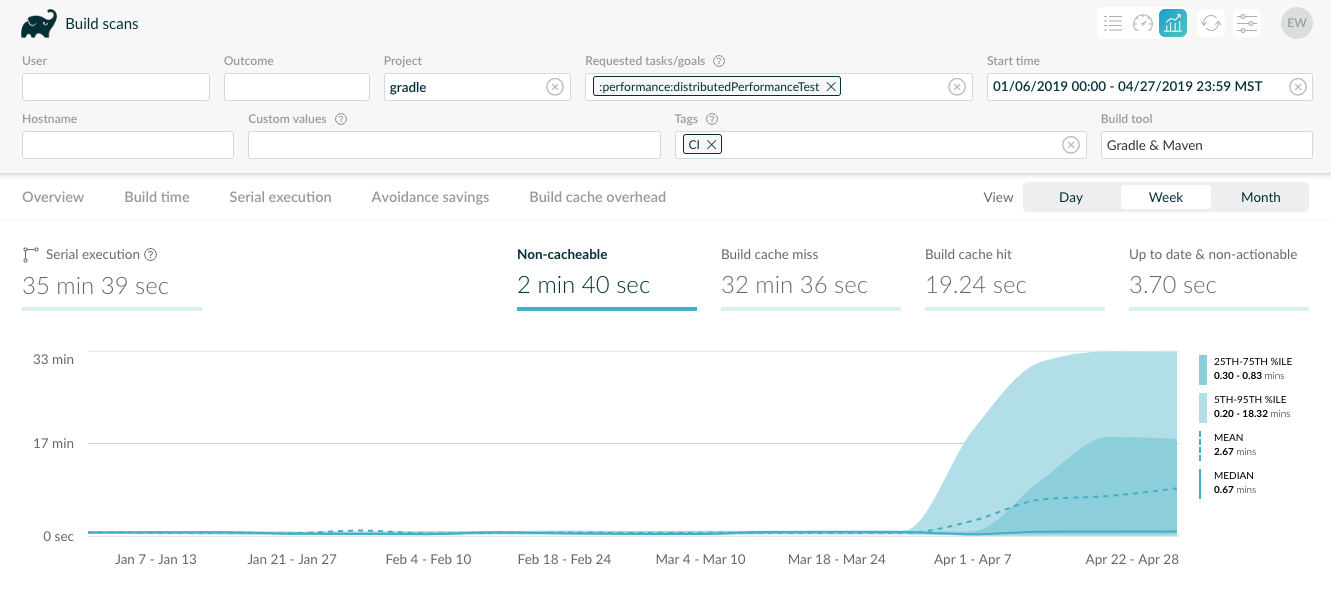
Build caching is highly-optimized at Gradle (as you’d expect). We can drill down into non-cachable execution time and see that most builds are still near 0, however, a non-trivial number of builds are spending time on non-cacheable tasks where they weren’t previously.
We zoom into the time just before and after the suspected change and the time resolution to daily.
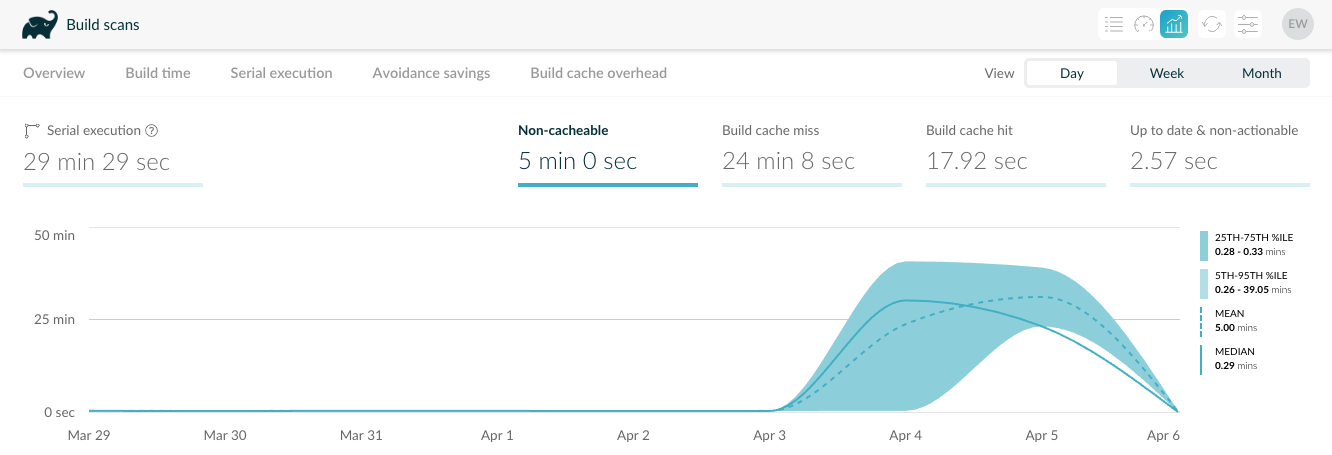
Now we can use the performance dashboard to drill into the build scans and see what’s going on
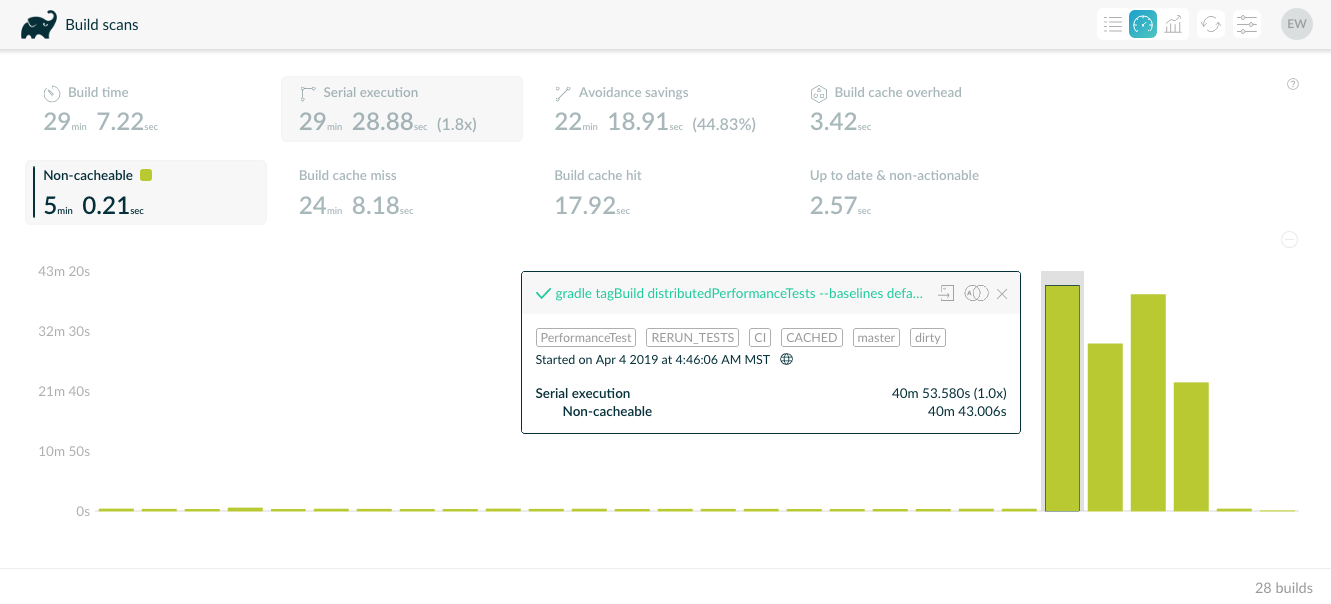
The highlighted build scan tells us what’s going on here.
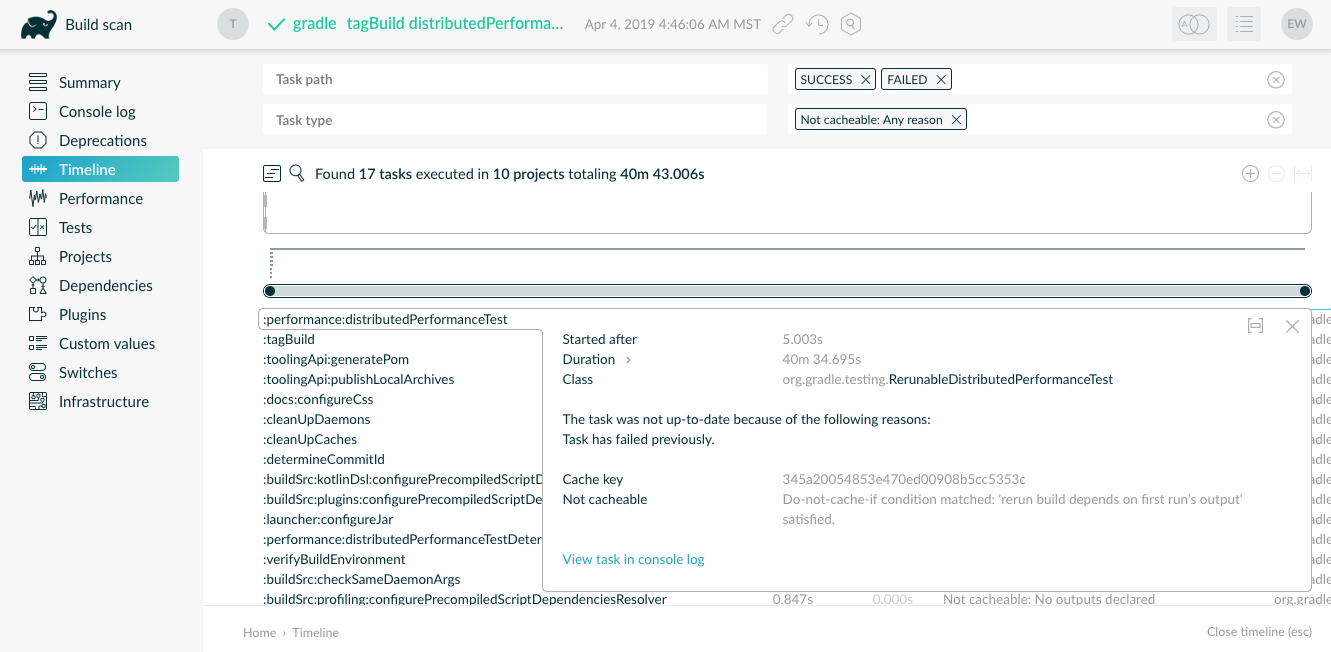
This tells us that someone added a doNotCacheIf {} condition in a change just before April 4th. Sure enough, we could trace it down to this change.
I hope this gives you a sense of how you can use this new feature to take action and prioritize positive changes with measurable results.
The next chapter in build analytics
I believe this is just the tip of the iceberg in the realm of analytics possibilities, and we’re excited to hear what you think of this new feature. Stay tuned for future updates.
Develocity users, please upgrade to 2019.2 and let us know what you think of this feature. Reach out if you would like to try this out and haven’t had the opportunity to do so yet.