Join the only event dedicated to Developer Productivity Engineering! Learn more

 Accelerate
 Troubleshoot
 Observe


Develocity 2025.2
We’re excited to announce Develocity 2025.2, which offers powerful new features and enhancements designed to increase the efficiency of your build and test processes!
Key highlights include:
- AI-powered Build and Test Failure Grouping in Build Scan®: Gain immediate, actionable, AI-driven insights into recurring build and test failures for Gradle and Maven projects.
- Failure Analytics and Test Failure Analytics for npm: Identify and prioritize fixing the most impactful build and test failures, test flakiness, and test slowness when using npm to build and test your JavaScript and TypeScript projects.
- Develocity Reporting and Visualization enhancements: Benefit from new and updated dashboards and a unified filtering experience, making it even easier to gain actionable insights into your organization’s build environment.
- High build performance and continuous build acceleration with Develocity Edge: Deploy Develocity services closer to build agents and developer workstations to benefit from increased build performance and more reliable build acceleration.
- Build execution insights in IntelliJ IDEs (Beta): Instantly spot bottlenecks and optimization potential in your builds right as they happen with real-time build timelines and resource usage directly within your IntelliJ IDE.
Highlights
AI-powered Build and Test Failure Grouping in Build Scan
Troubleshooting build and test failures can be a time-consuming challenge, often involving vast amounts of unstructured data. Understanding the cause of a single build failure can require extensive digging through logs, and gathering insights across numerous different failures quickly becomes overwhelming. With the general availability of Build and Test Failure Grouping in Build Scan for Gradle and Maven projects, you can now effortlessly troubleshoot your failed Gradle and Maven builds.
This powerful feature uses AI to intelligently group similar build and test failures in your Build Scan summary, providing a clear and concise overview of recurring issues. By quickly identifying patterns and root causes, you can significantly reduce the time spent debugging failed builds and instead focus on resolving critical problems, ultimately improving your overall build stability.
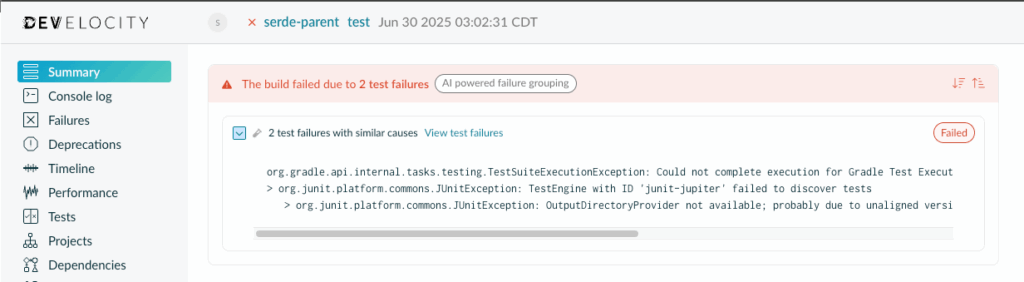
AI-powered failure grouping
Failure Analytics and Test Failure Analytics for npm
The most popular package manager for JavaScript projects is npm. Develocity for npm, now generally available, provides Failure and Test Failure Analytics for your npm invocations. You can efficiently identify and prioritize fixing the most impactful build and test failures, test flakiness, and test slowness when building and testing your JavaScript and TypeScript projects. It builds on the support for capturing environment information, console logs, and test insights for the Jest, Mocha, and Cypress test frameworks
Failure Insights
The Build Scan of a failing npm invocation allows you to instantly pinpoint what went wrong, even when multiple failures happened.

Failure Insights for npm
Failure Analytics
The ML-based failure aggregation in the “Failures” dashboard enables you to efficiently triage and prioritize the issues of highest impact and narrow down the underlying root cause.
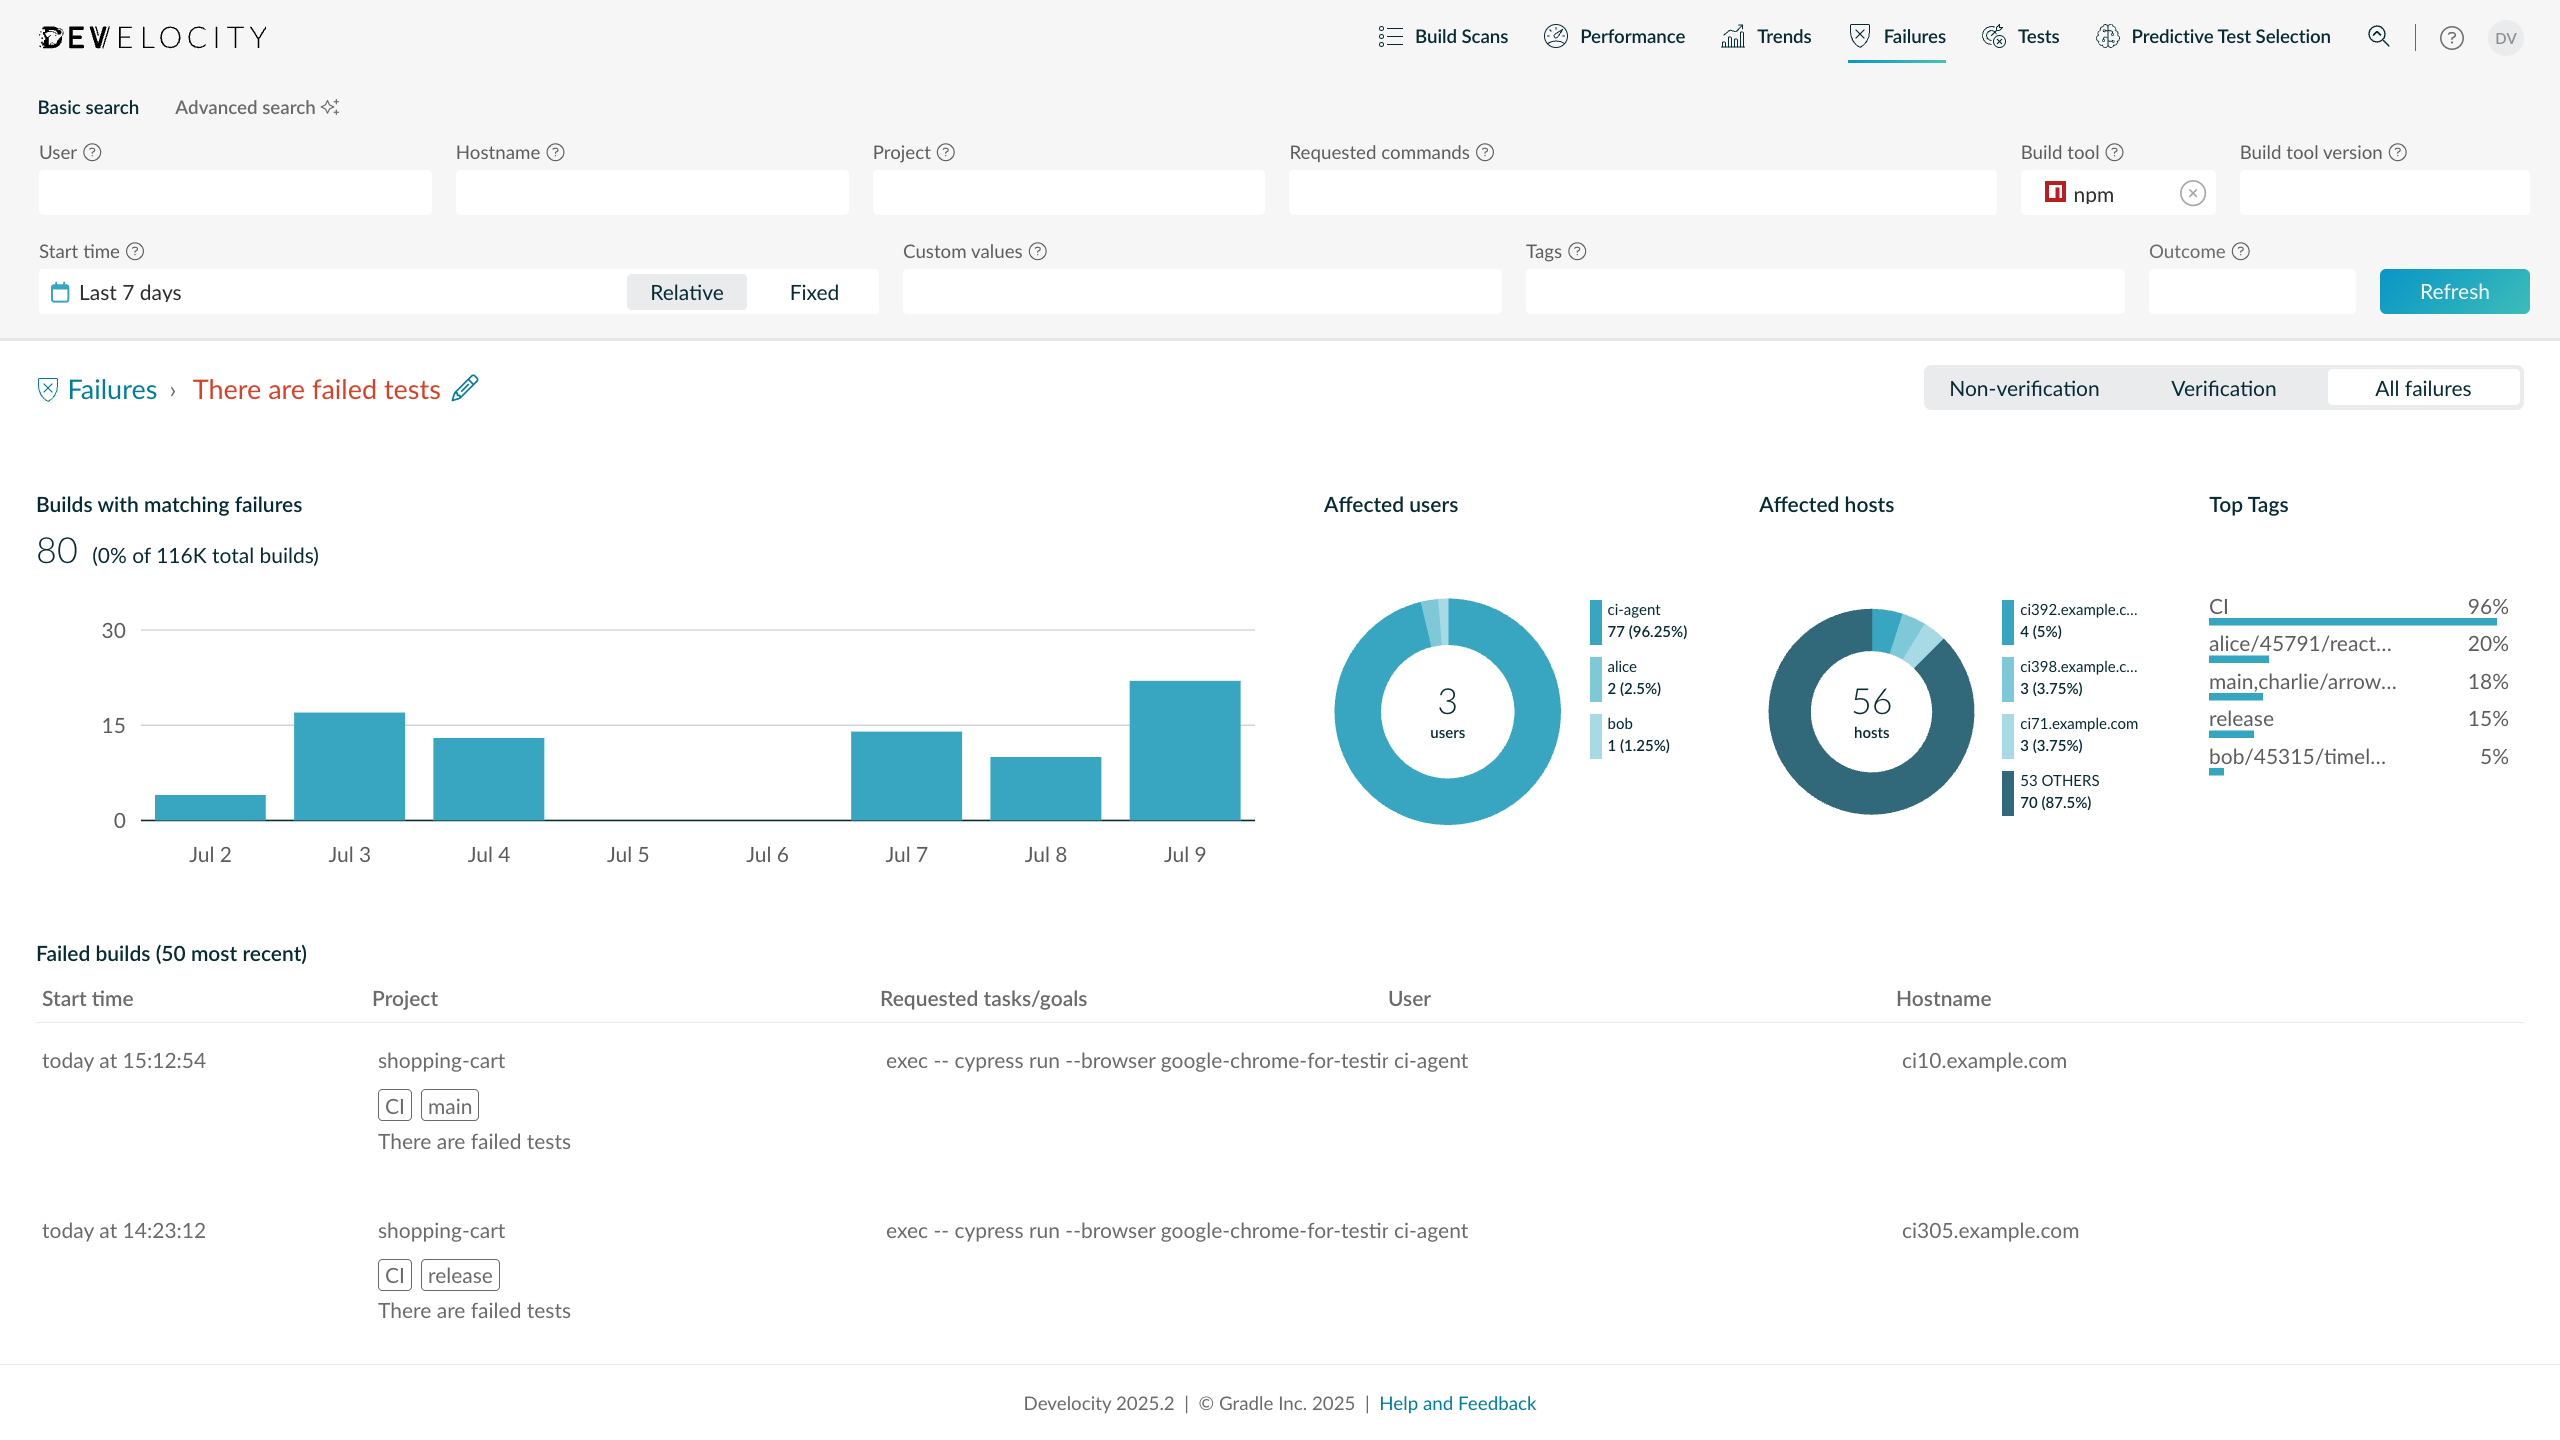
Failure Analytics for npm
Test Insights for Cypress
Cypress is one of the most widely used end-to-end testing frameworks for JavaScript. A dedicated test reporter can be enabled to capture test insights for Cypress. Test reporters for Jest and Mocha are also available.
Test Failure Analytics
Test insights captured for all supported test runners are aggregated in the “Tests” dashboard. This dashboard surfaces failing, flaky, and slow tests and enables you to prioritize fixing those that most impact your team. This is particularly valuable for end-to-end tests that are commonly affected by non-deterministic behavior and performance issues.
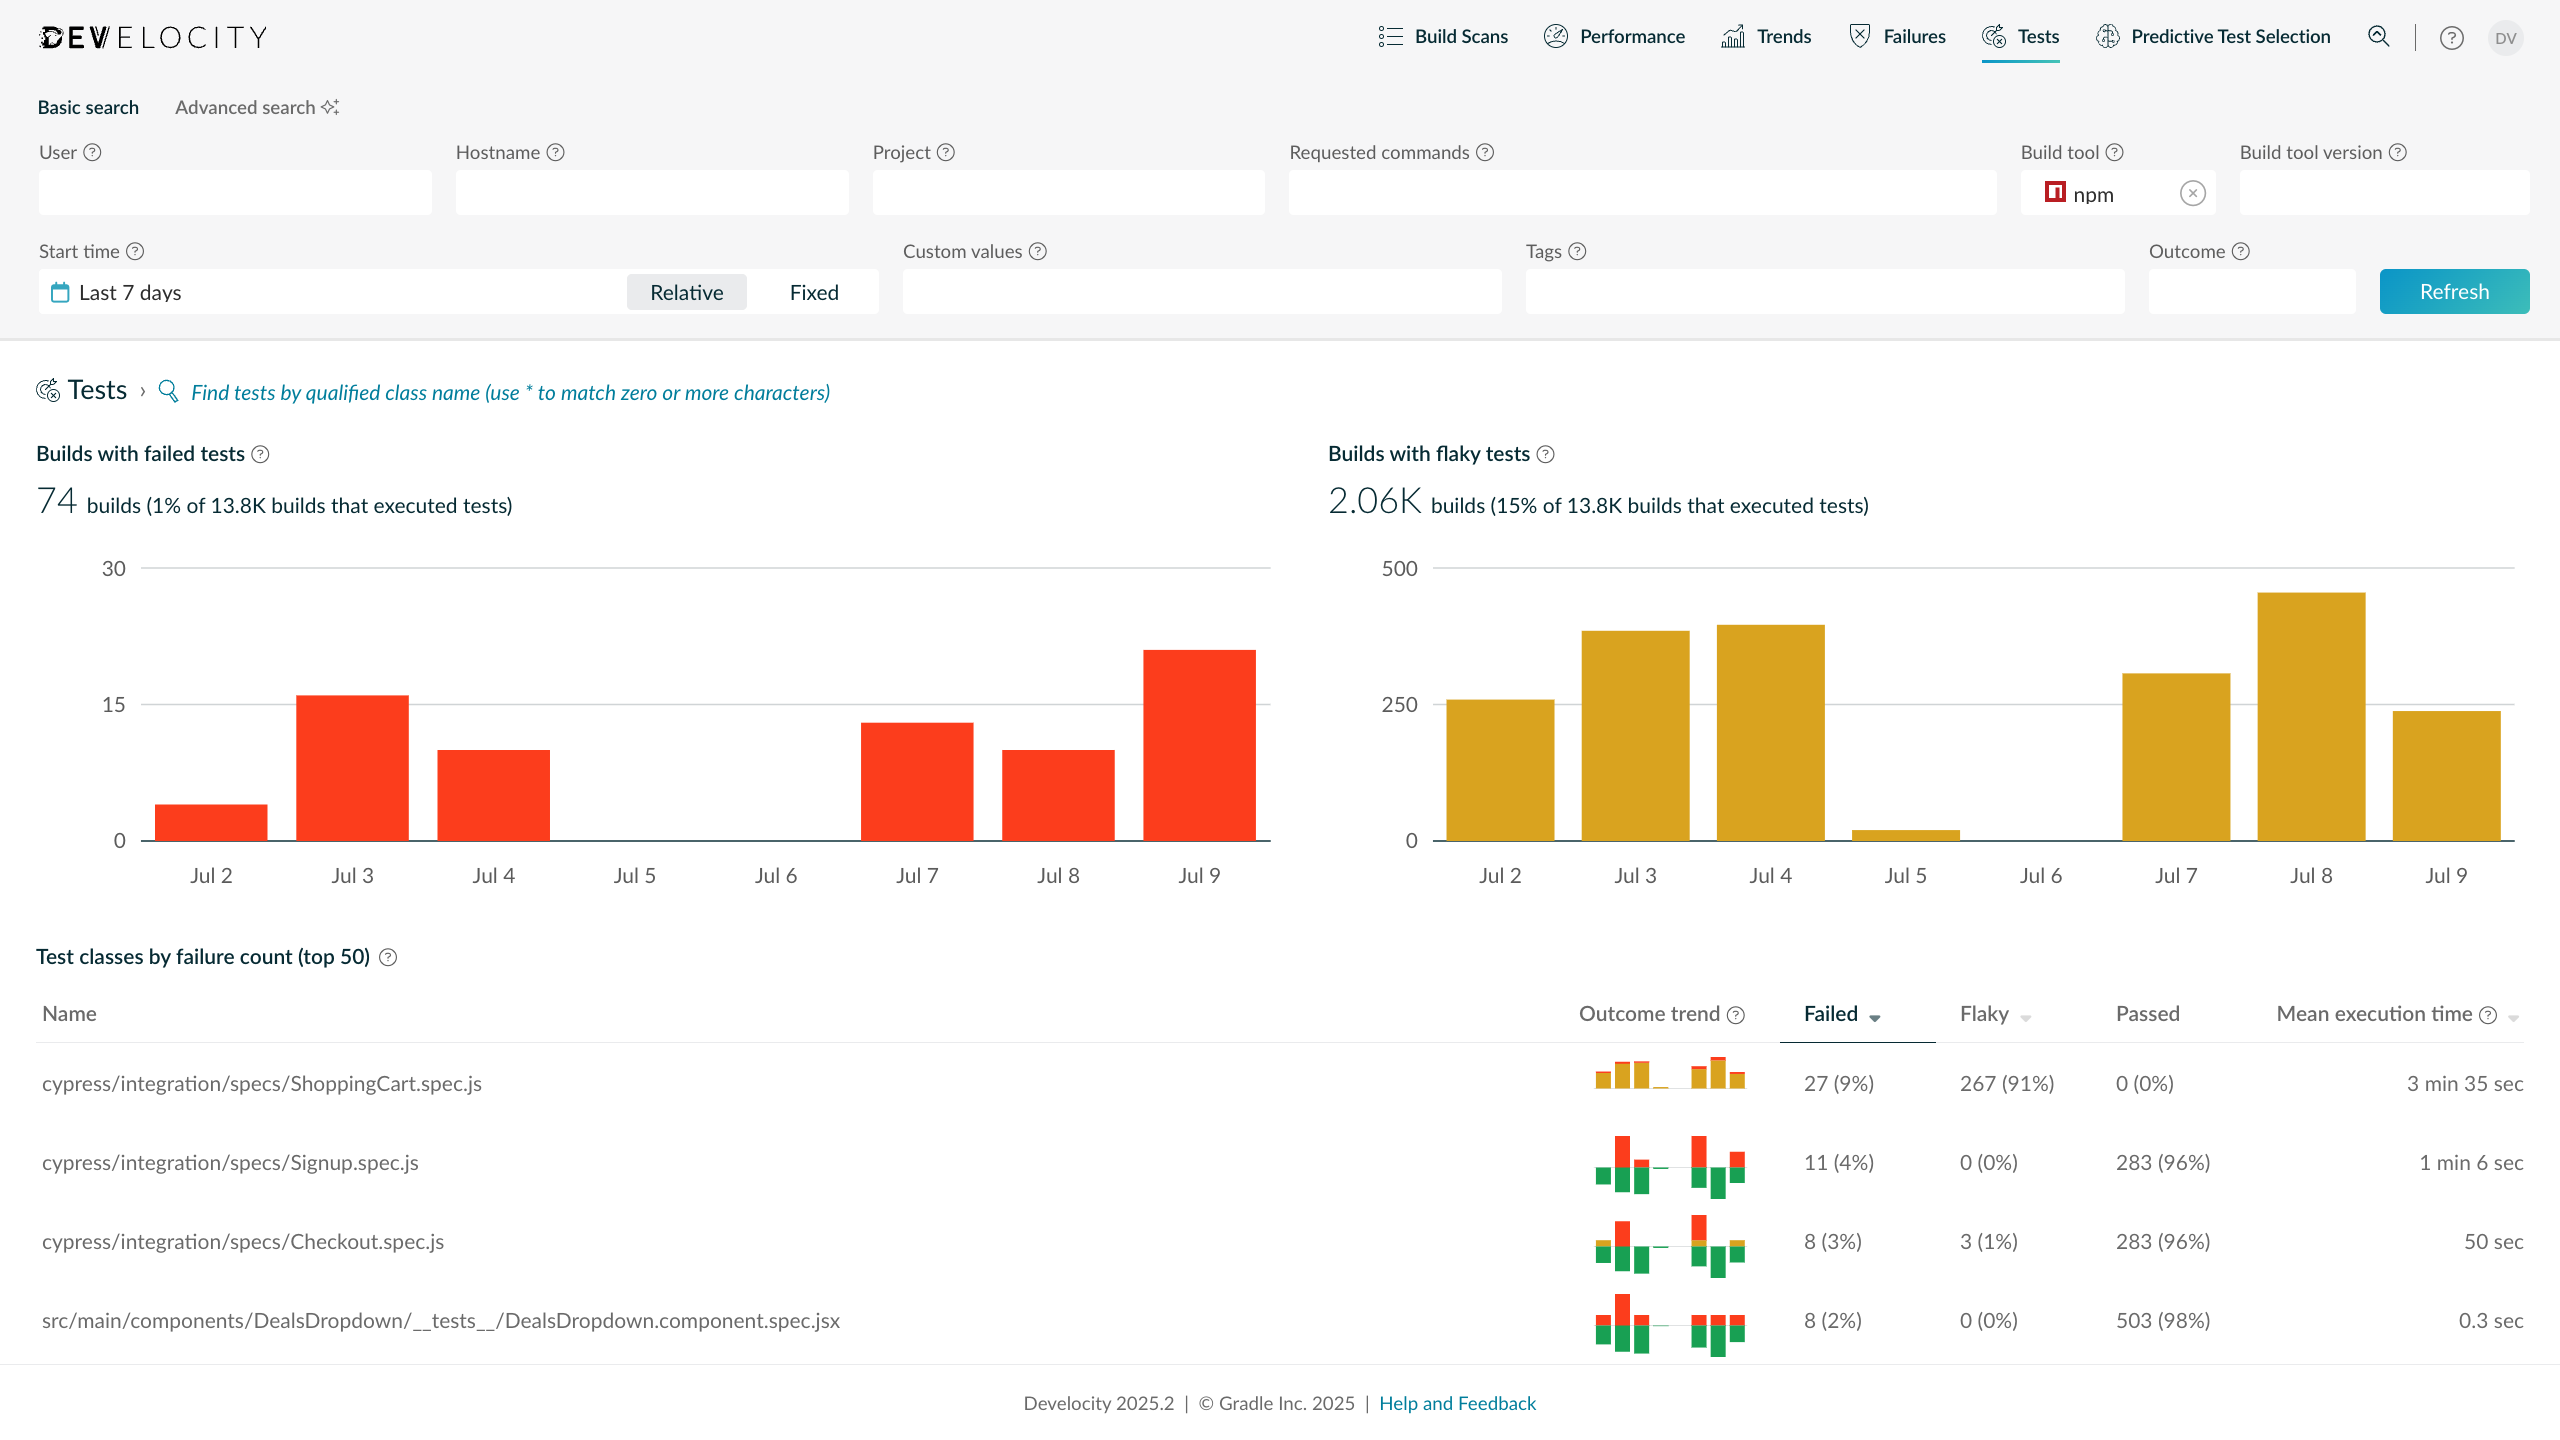
Test Failure Analytics for tests run via npm
npx Support
The npx command-line tool is part of npm and allows you to run arbitrary commands from a local or remote npm package. Develocity offers the same level of support for npx as for any npm subcommand.
Develocity Reporting and Visualization Enhancements
Develocity offers new and updated dashboards and a unified filtering experience, making it even easier to gain actionable insights into your organization’s build environment. When leveraging Develocity Reporting and Visualization via AWS Athena, Develocity now manages your Athena table and view definitions, which simplifies the upgrade process.
Build Cache Savings Potential Dashboard
This new dashboard helps you understand how much faster your Gradle or Maven builds would be for each project if they used the build caching functionality. As a result, you’ll understand the build cache acceleration opportunities and can prioritize the build cache enablement accordingly
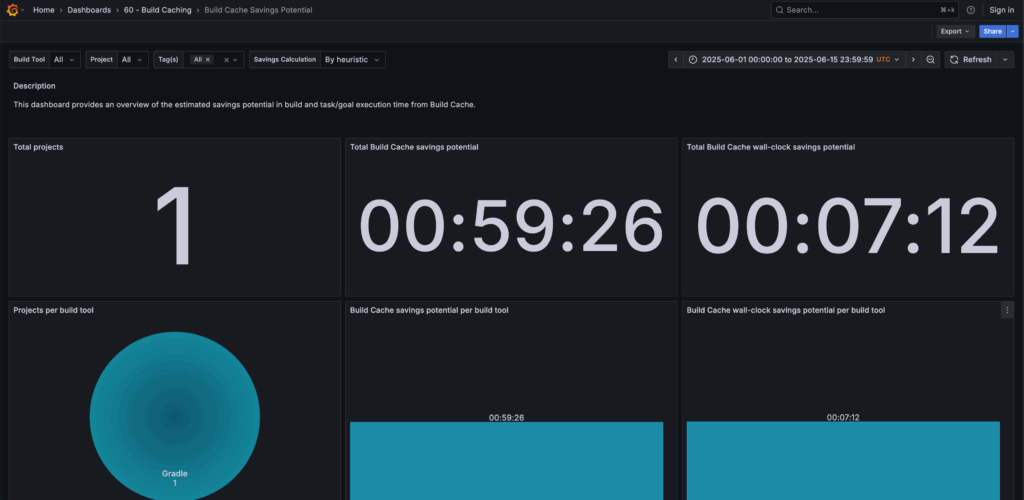
Build Cache Savings Potential dashboard
Maven Extensions Dashboard
This new dashboard gives you an overview of which extensions your Maven builds apply across all projects. It allows you to track the adoption of in-house convention extensions and surface 3rd-party extensions that might unexpectedly be used in your organization.
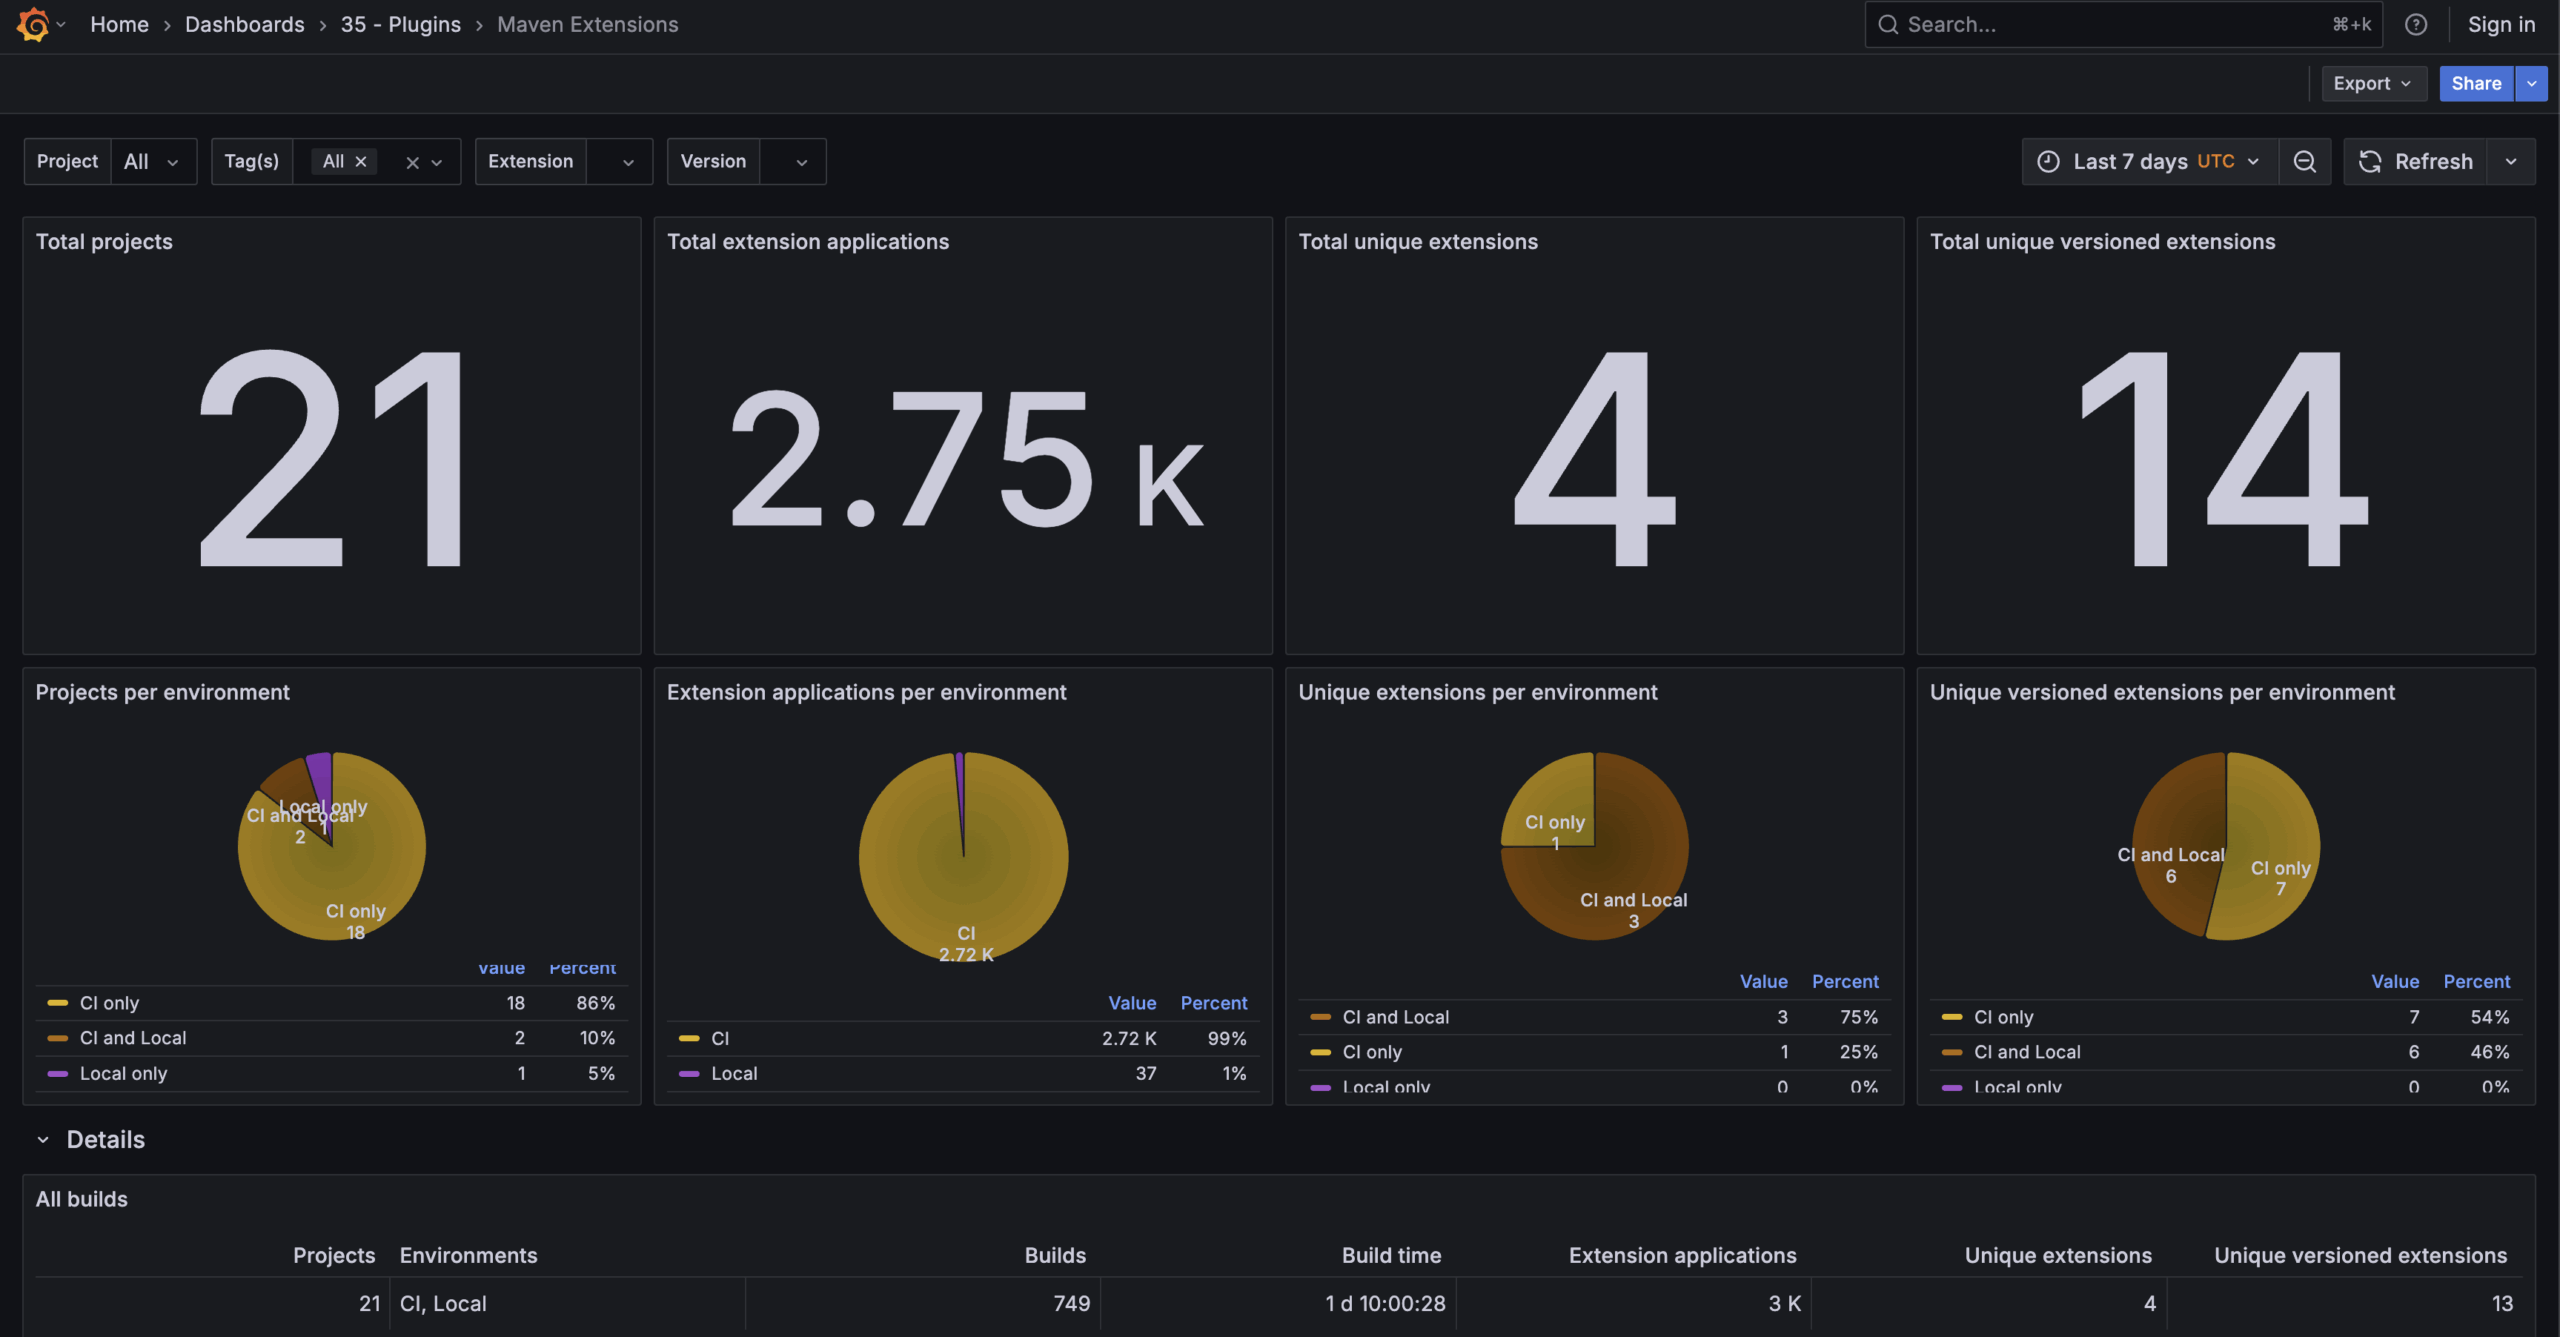
Maven Extensions dashboard
Dependencies Dashboard
This dashboard has been updated to help you understand the artifact repositories used to download dependencies in your builds. It can help you identify the repositories used in a project, understand which projects use a certain repository, or pinpoint where a particular dependency originated.
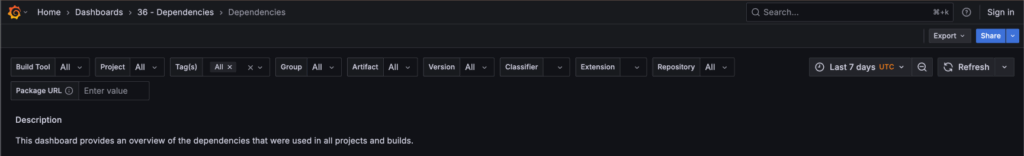
Dependencies dashboard – New “Repository” filter

Dependencies dashboard – New “Details per repository” section
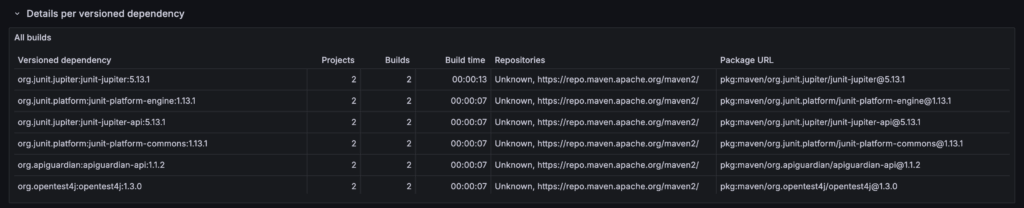
Dependencies dashboard – New “Repositories” column
Dependency Downloading Dashboard
This dashboard has been updated to show the trends of download volume, download time, and contribution to build time.
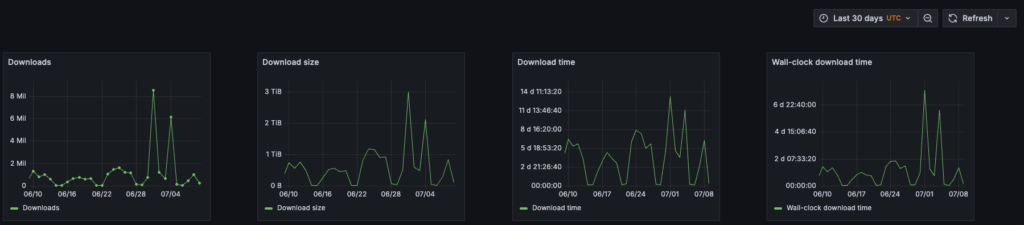
Dependency Downloading dashboard – New “Trends” section
Maven Fail-never Setting Dashboard
This new dashboard surfaces the Maven builds across all projects that were run with the --fail-neverflag. These builds might unintentionally have their build failures suppressed.
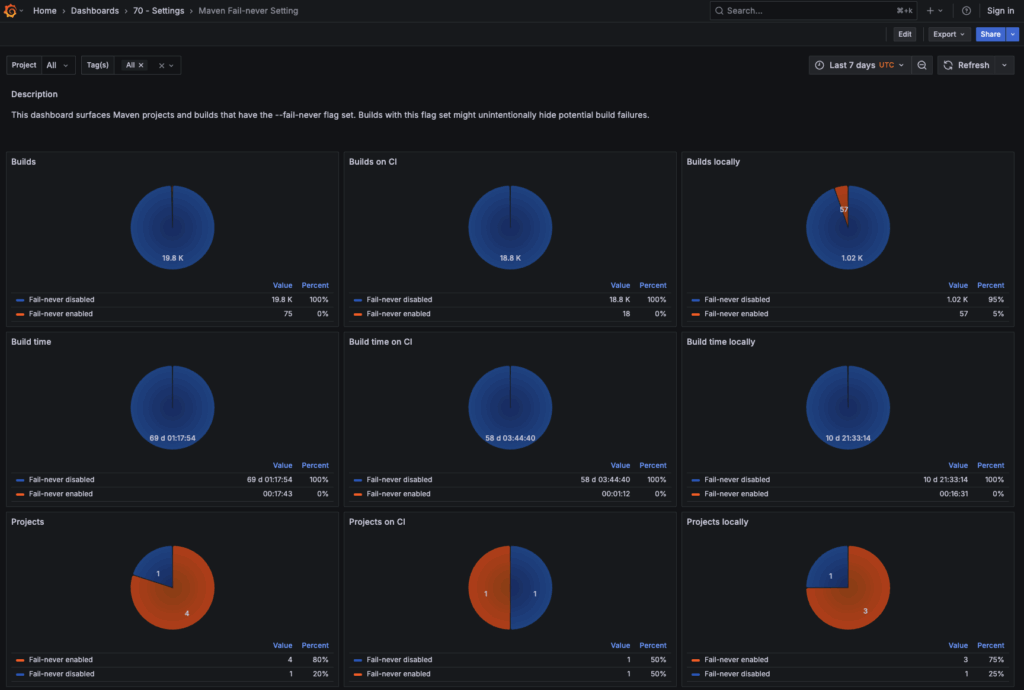
Maven Fail-never Setting dashboard
Data Filtering Support
All dashboards provide an enhanced and consistent filtering experience. On each dashboard, you can filter by project and by tags to precisely drill down into the builds most relevant to you, gaining finer-grained insights into your organization’s build environment.

Filtering by Project and by Tags
Managed Athena Schema
As of this release, Develocity can manage the table and view definitions required to use Develocity Reporting and Visualization via AWS Athena. This removes the need to manually apply SQL statements to update the AWS Athena installation to match the Develocity version used, providing Develocity administrators with a smooth, automated upgrade experience.
This is a new opt-in feature for customers using version 2.0 of Develocity Reporting via AWS Athena. Customers who prefer to manually apply the DDL statements or who have built their own automation can still do so. You can download the latest dashboard bundle definitions from our documentation.
High Build Performance and Continuous Build Acceleration With Develocity Edge
Develocity Edge, first announced in Develocity 2024.3 and now generally available, provides Develocity services with high availability and closer to where builds are run. It also speeds up builds by reducing network latency. The Remote Build Cache is the first service that uses Develocity Edge. More services will leverage Develocity Edge in upcoming releases.
Develocity Edge helps your builds run faster and more reliably by bringing Develocity closer to your build infrastructure and developer workstations. Think of an Edge as a smart, geographically distributed point that acts like a local hub for your builds. By placing redundant Edge nodes near where your Gradle, Maven, sbt, and Bazel builds run, Edge reduces network delays and connectivity issues and enables high availability of its services. The results are improved build performance and more reliable build acceleration.
The Edge backend provides flexible setup options, allowing it to be configured via unattended configuration or through the Administration UI.
Flexible Deployment & High Availability
Setting up Develocity Edge is flexible and straightforward. You can deploy Edge nodes as a Docker image or standalone JAR, running them on platforms like Kubernetes or other modern computing environments. You can deploy multiple Edge nodes as a cluster to enable high availability. These co-located Edge nodes can also peer with each other, allowing them to share build artifacts directly. This smart peering speeds up access to newly stored build artifacts and reduces the amount of data fetched from your central Develocity server, saving you network costs.
Resilient Remote Build Caching
The resilience of remote build caching increases when builds use Edge discovery across multiple locations. Previously, if a build experienced a build cache error, remote build caching would be turned off for the rest of that build. With Edge discovery enabled, if an error occurs while interacting with one Edge’s Remote Build Cache service, your build agent will automatically try to switch to another available Edge. This means your builds keep benefiting from remote build caching and continue to save precious build time, even if there’s a hiccup during the build.
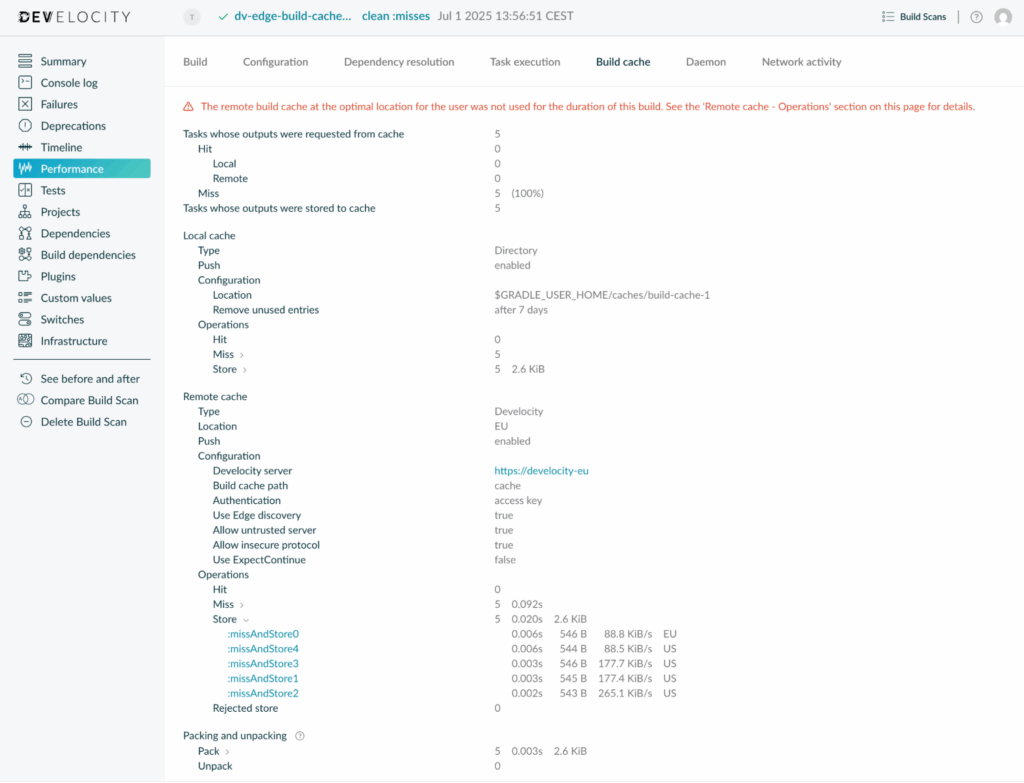
Build cache insights in the case of an Edge fallback scenario
Please visit the Develocity Edge user manual to learn more.
Build Execution Insights in IntelliJ IDEs (Beta)
The new Develocity IntelliJ Plugin (Beta) brings the power of Develocity directly into your IDE (Integrated Development Environment) environment. This initial version offers seamless integration with your IntelliJ IDE, providing real-time visibility into your Gradle builds.
Inspired by JetBrains’ Compilation Chart, this plugin extends similar live insights to your Gradle projects. Instead of waiting for your build to complete or switching to external tools, you can now monitor a live timeline of task execution and real-time resource usage graphs (CPU and memory) directly within your IDE. This immediate visualization accelerates feedback loops, providing a clear understanding of build performance as it unfolds.
The Develocity IntelliJ plugin streamlines the initial Develocity setup by providing configurable auto-injection of the Develocity Gradle plugin and the Common Custom User Data plugin. From IntelliJ’s preferences, you can connect your build to Develocity or the free Build Scan service in an instant.
Compatibility: This Beta plugin is compatible with IntelliJ IDEs starting from version 2025.1 and is available for IntelliJ IDEA Community and Ultimate editions, as well as Android Studio. Real-time build insights require the Develocity Gradle plugin 4.1 or newer to be applied to your Gradle build, either manually or via the plugin’s convenient auto-injection support.
Live Build Timeline with CPU and Memory Usage
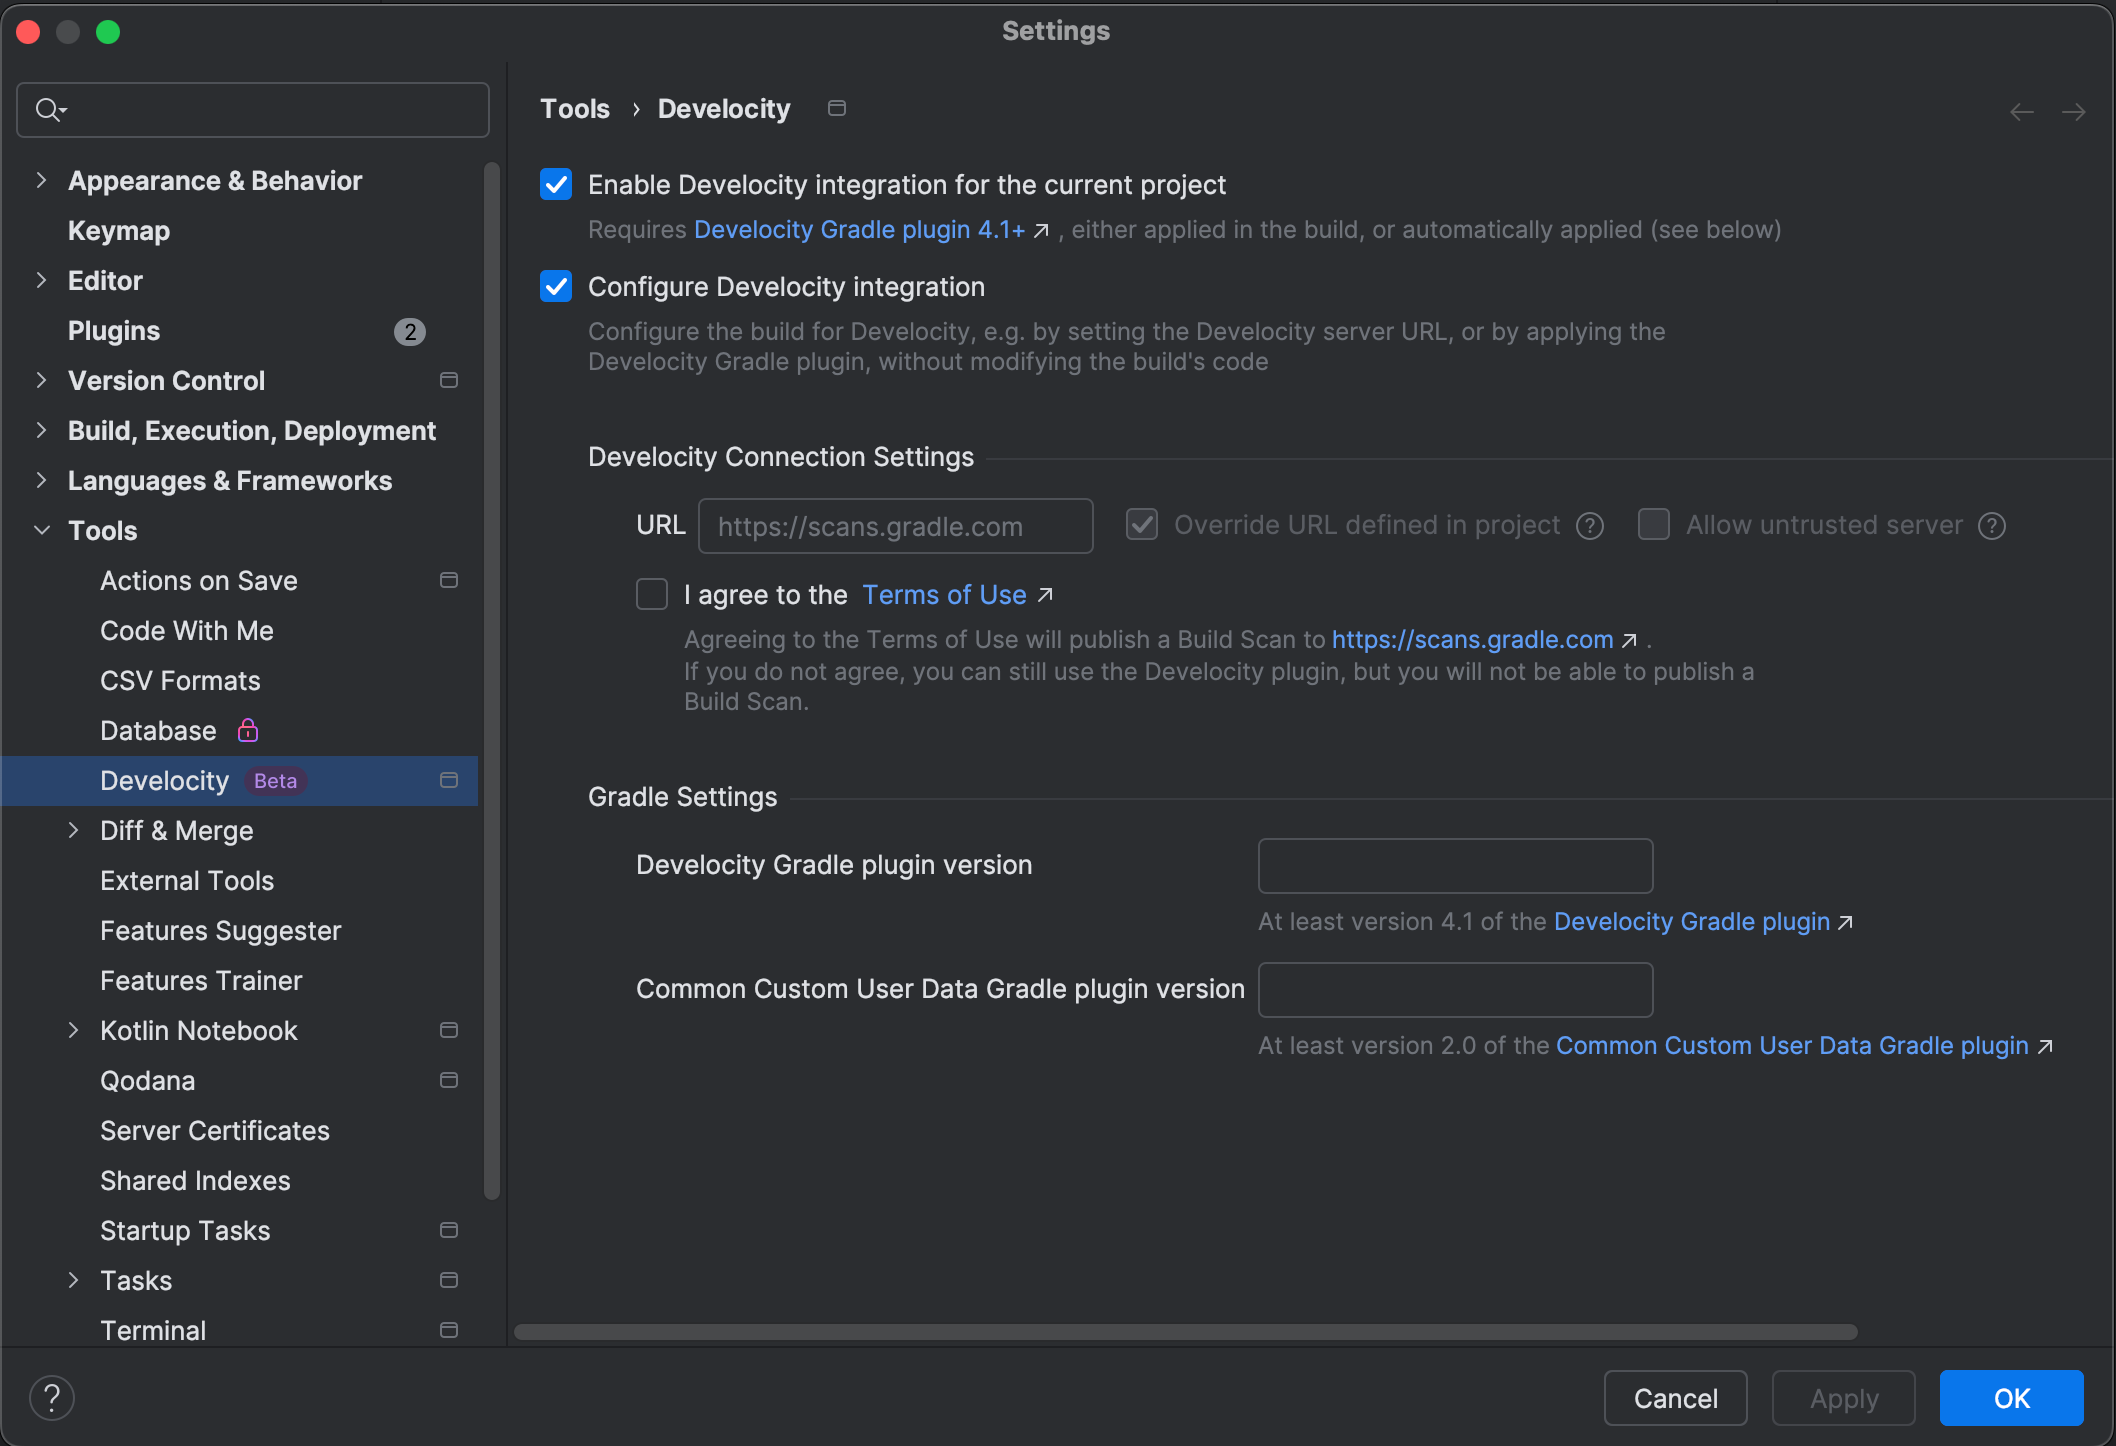
Apply and configure the Develocity Gradle Plugin via IntelliJ IDE settings
Test Execution Data Retrieval via the Develocity API
A new API endpoint is available to retrieve test information across your Gradle, Maven, sbt, npm, Python, and Bazel builds. You have access to detailed test execution data for an individual build, including insights into which tests were unstable or slow.
This new endpoint opens up exciting possibilities for custom test reporting. For example, it can be leveraged to inform pull request authors about all test failures related to the new changes they’ve introduced. By combining this endpoint with the existing /api/tests/containers and /api/tests/cases endpoints, you can gain a much deeper understanding of how tests behaved in the current build compared to past builds.
For comprehensive details on the new /api/tests/build/{id} endpoint, please refer to the Develocity API Documentation.
Build Cache Performance Observability for sbt
The Build Scan of an sbt build provides Build Cache configuration and performance insights. For both the local and remote build cache, all build cache operations and their outcomes are listed, including performance metrics. Direct links to the Timeline view allow you to pinpoint the precise impact of the Build Cache on your build’s performance. If any build cache operations encounter issues, they will be annotated with helpful information to resolve their issues quickly.
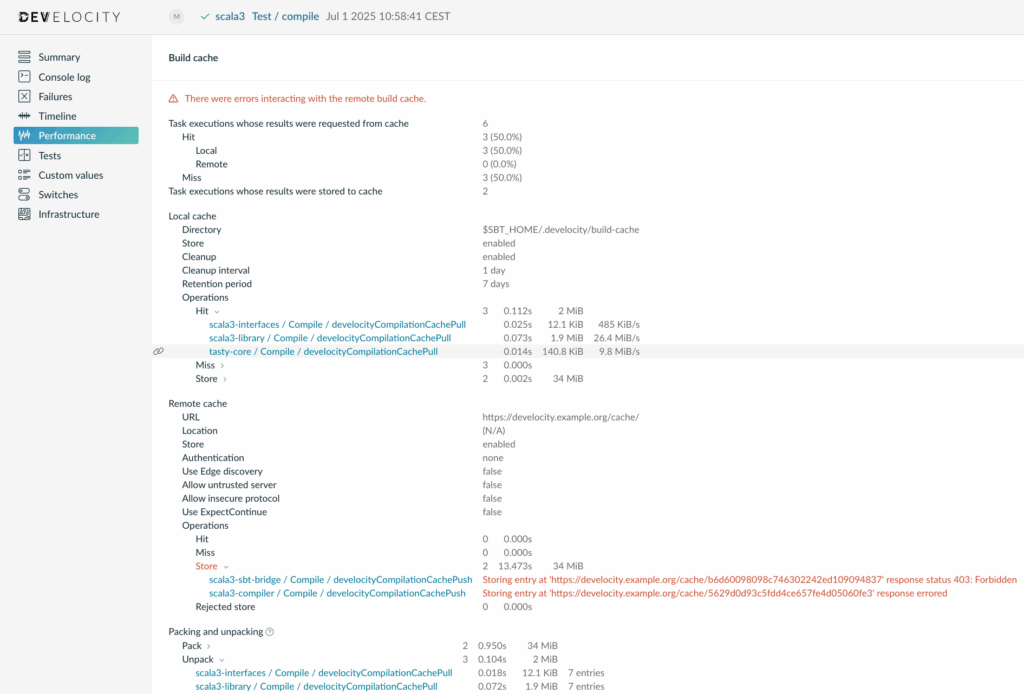
Build Cache Performance observability for sbt
Common Custom User Data Plugin for sbt
The sbt Common Custom User Data plugin is now available. This plugin enhances published Build Scan data by adding a set of tags, links, and custom values that have proven useful for many projects using Develocity.
This feature significantly simplifies understanding your builds by automatically adding relevant tags and custom values to every Build Scan. This rich, out-of-the-box data makes it easy to quickly identify key details, such as whether a build ran locally or on your CI, or the specific Git commit SHA that was built, and much more. This means quicker filtering, better analysis, smoother troubleshooting, and performance optimization.
You can leverage the sbt Common Custom User Data plugin in one of two ways:
- Apply the published plugin: Directly apply the plugin in your build to immediately benefit from an enhanced Build Scan.
- Customize the plugin: Copy the sources and develop a customized version of the plugin to standardize Develocity usage across your organization.
Upgrade notes
Integrations
Ensure the following versions are installed to have the best experience and full compatibility with the latest features:
- Develocity Gradle plugin: 4.1
- Develocity Maven extension: 2.1
- Develocity sbt plugin: 1.3
- Develocity npm agent: 1.0.1
- Develocity npm agent loader: 1.0.0
- Develocity Python agent (beta): 0.10
- Develocity Edge: 1.0
- Develocity Build Cache node: 21.2
- Develocity Test Distribution agent: 3.4
- Develocityctl: 1.18
- Develocity Reporting Kit: 1.4
- Develocity Reporting Dashboards bundle: 1.6.2
- Develocity Inteliji plugin (beta): 0.5.1
Ensure you are using the latest version of the Develocity plugin for your CI provider:
Discontinuation
The Alpine-based Docker images are no longer available. See the Upgrade Guide for more information.
Support for sbt versions older than 1.9.0 has been discontinued. If you have any questions or concerns, please don’t hesitate to contact the Develocity support team.
Deprecation
Develocity Build Cache Node discontinuation by the end of 2026
Support for the Develocity Build Cache Node component will be discontinued at the end of 2026. This means that versions of Develocity starting with Develocity 2027.1 will no longer support this component.
We strongly recommend that users of the Develocity Build Cache Node start migrating their deployments to Develocity Edge. Develocity Edge serves the same purpose as a remote build caching service for your build agents, but is designed to be simpler and more robust to operate. The Develocity Edge User Manual provides all the information you need to configure and operate Develocity Edge.
Looking Ahead to Changes in the Next Major Release (2025.3)
Develocity Reporting and Visualization
Currently, the build data imported by the Reporting Kit 1.x and the AWS Athena integration 2.0 is retained indefinitely. Going forward, we will align the data retention window between the Reporting Kit, the AWS Athena integration, and Develocity. Starting with Develocity 2025.3 and Reporting Kit 2.0, the build data imported by the Reporting Kit and AWS Athena will be automatically deleted once the Build Scan data is past the retention period configured in Develocity.
If you rely on the imported build data being available longer than the Build Scan data retention period configured in Develocity, we would love to hear from you. Your input will help us shape the experience to better meet your needs.
The release notes of the next major release will provide detailed guidance and reminders. In the meantime, feel free to contact us with questions.
Deprecation and Removal of Support for PostgreSQL Versions 12 and 13
Develocity currently supports storing data in a user-managed database running PostgreSQL versions 12 to 17. PostgreSQL 12 reached its end-of-life on November 24, and PostgreSQL 13 will reach its end-of-life in November 2025. See the PostgreSQL versioning page for more information.
As these versions will no longer receive security updates, they are deprecated for use with Develocity. A deprecation warning has been shown to administrators of Develocity instances using such a PostgreSQL version since version 2024.3.
We intend to remove support for PostgreSQL 12 and 13 in Develocity 2025.3. Feel free to contact us with questions.
Changes
Jul 15, 2025
- [NEW] Build Scan: Build and Test Failure Grouping in Build Scan for Gradle and Maven is enabled by default
- [NEW] Build Scan: The remote Build Cache servers used over the duration of a build are displayed on the Performance page
- [NEW] Add ability to configure automatic schema management for Develocity Reporting via AWS Athena
- [NEW] Add support for populating the `repository_url` qualifier within Gradle and Maven dependency API responses
- [NEW] Configurable Pod Security Context
- [NEW] Dependencies dashboard includes "Recent matching build" section instead of "Details per build" section
- [NEW] Disabled call-home functionality in Grafana tools (Mimir, Loki, Alloy) for enhanced data privacy and control
- [NEW] Ingress supports Develocity Edge endpoints using `gRPC`
- [NEW] Java heap memory is now dynamically calculated