Gradle Enterprise is now...

The leading Developer Productivity platform
Build better
software, faster
Get back one day a week
Develocity® speeds up your builds and tests, makes troubleshooting more efficient, and increases toolchain reliability, giving your developers back at least one day each week in lost productivity. Now supporting Maven, sbt, and Gradle build systems.
Used by leading tech and global business brands
Imagine a world where your developers spend less time waiting on builds and tests to complete or dealing with failures. Let's make that a reality.
Accelerate your builds and tests locally and on CI
Avoid the pain of slow builds, unnecessary idle time, context switching, and interruptions to the creative flow.
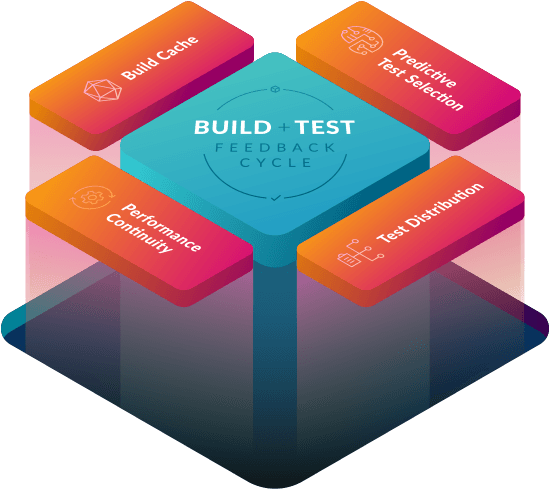
Avoid unnecessary build actions
Build Cache avoids running components of builds and tests whose inputs have not changed.
Learn MoreAvoid running irrelevant tests
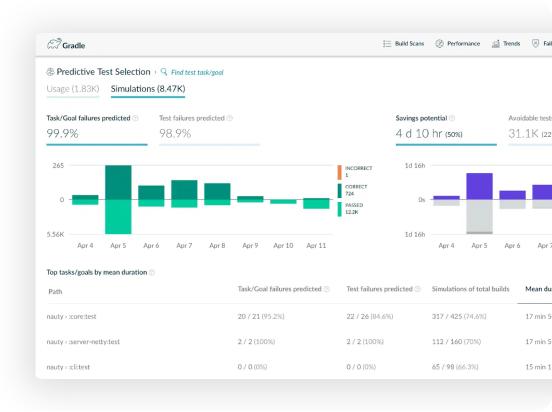
Predictive Test Selection only runs tests that are likely to provide useful feedback using machine learning.
Learn MoreDistribute test execution
Test Distribution runs the necessary and relevant remaining tests in parallel to minimize build time.
Learn MoreSustain performance gains
Performance Continuity leverages build data observability to analyze performance and make continuous improvements.
Learn MoreImpact by the numbers
Cut test time up to
0%
Decreased build time by
0%
Active
build & test monitoring
address avoidable failures
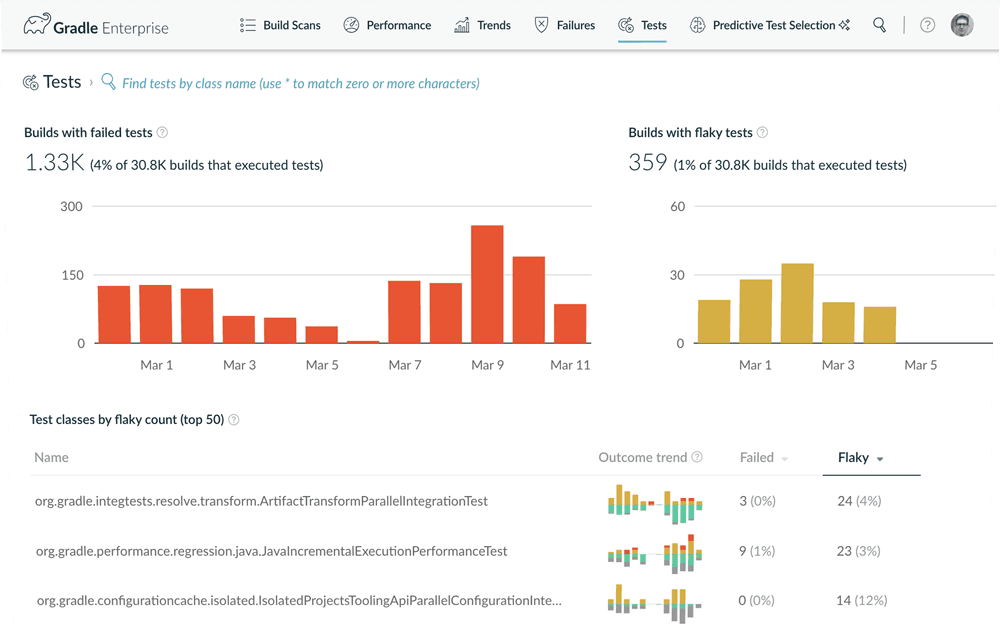
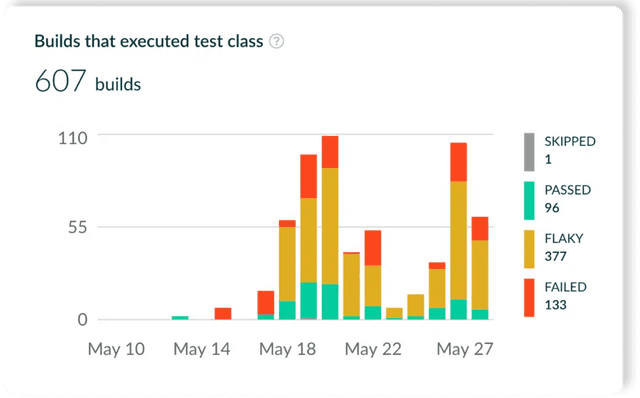
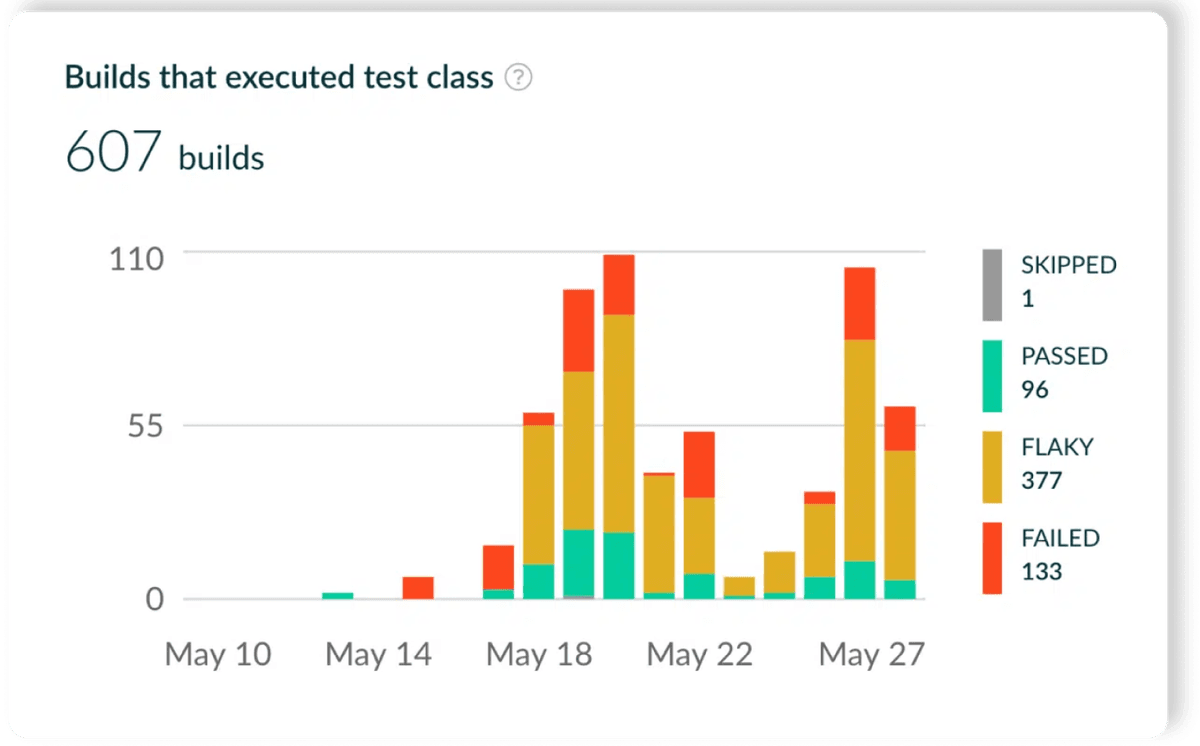
Find unreliable builds and tests, like flaky tests, learn how many people and environments are affected, share information about them, and understand the root cause efficiently.
Learn More
troubleshoot failures
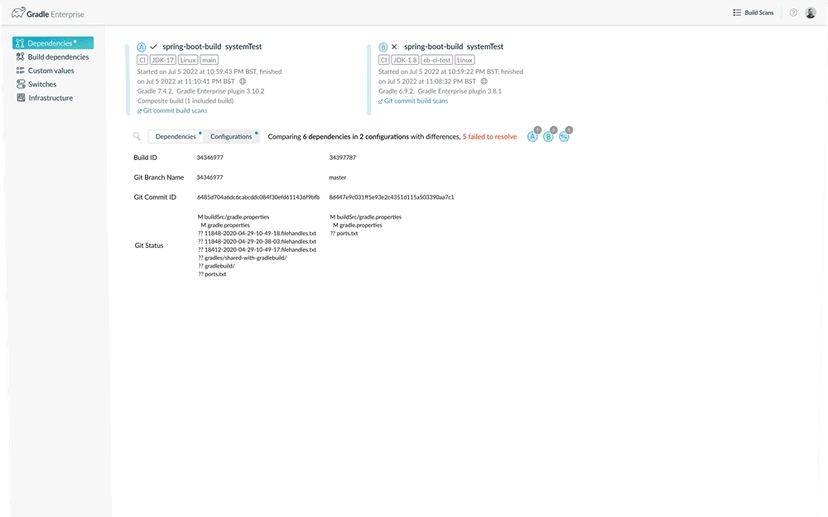
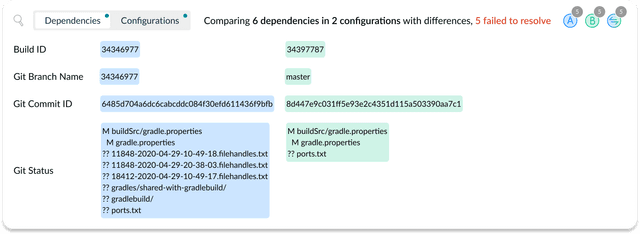
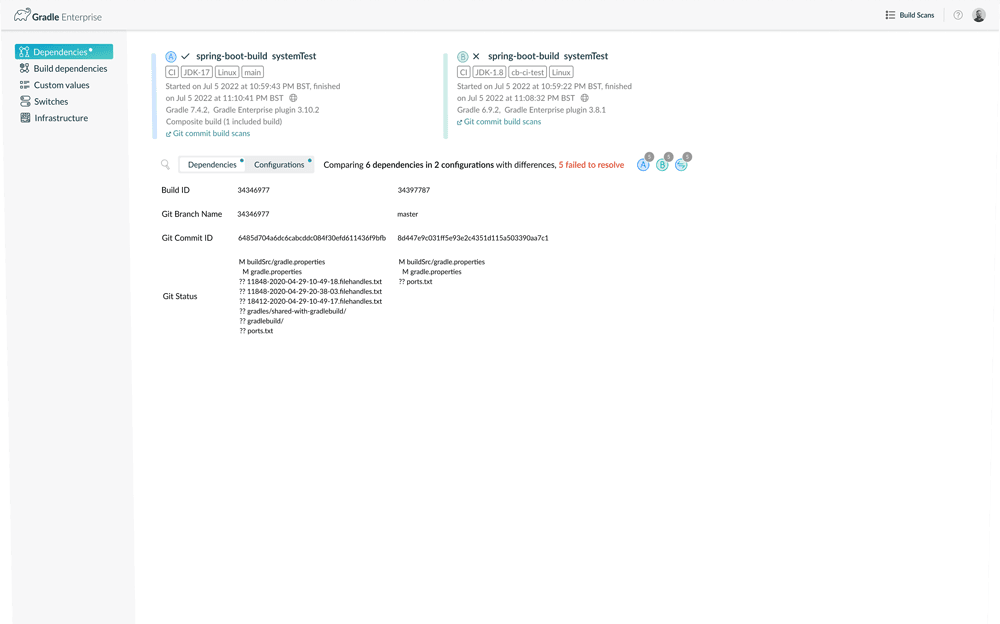
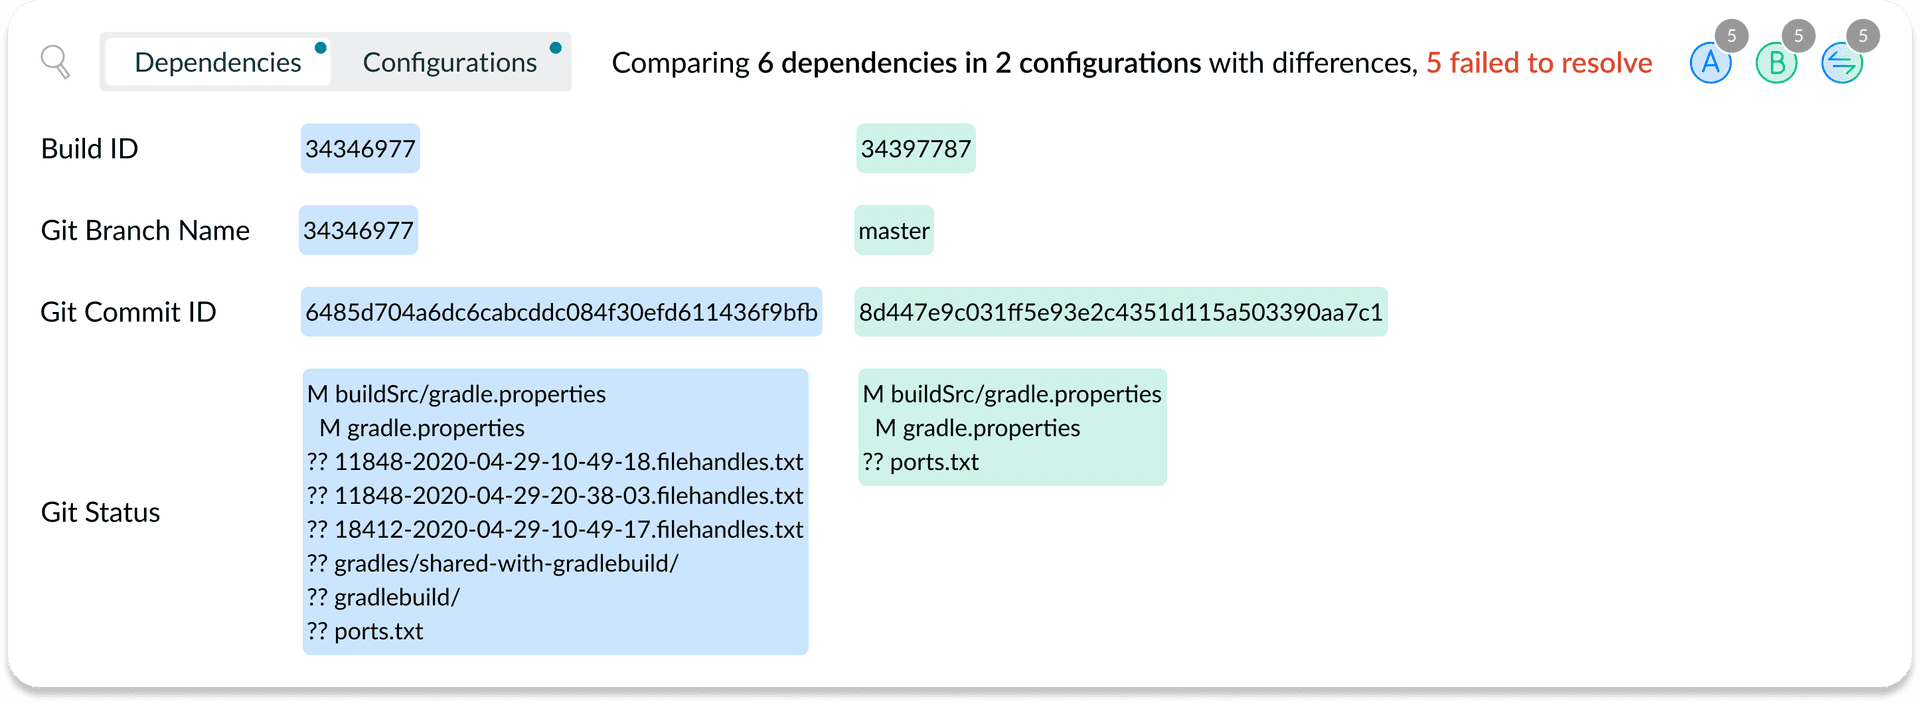
Use Build Scan® to get detailed build action and environment data and metrics for every build to rapidly determine the problem root cause. Enhance your failure analysis with Failure Analytics dashboards.
Learn MoreWe support multiple build systems
Our goal is to democratize the developer productivity benefits of Develocity for all dev teams across the enterprise.
- maven build
- sbt build
- gradle build
Develocity integrates with all CI systems
Develocity offers plug-ins and templates for a convenient and feature-rich integration with Bamboo, GitHub Actions, GitLab, Jenkins CI, and TeamCity. Take your CI throughput and observability to the next level. Develocity is also an indispensable tool for CI migration.
Learn More


Develocity is compatible with all popular deployment
environments
Develocity is flexible to deploy and integrates easily with your existing application deployment infrastructure.
Learn More


Get deep reporting & insights
Leverage our ready-made and custom-built dashboards to discover new insights and track and share your organization's productivity outcomes.
Improve business outcomes with out-of-the-box insights.
Get quick access to fundamental data points with our dashboards, such as aggregated build execution time, test failure trends, or average failure resolution time.

“Develocity gives us the metrics we need with very little effort and helps us understand the impact of our work on the overall system.”
Criteo
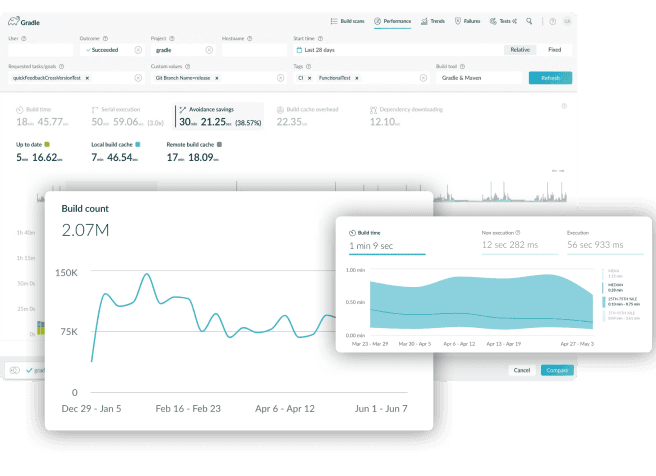
Generate custom reports and discover new insights.
Develocity can be integrated with external business intelligence, reporting, and monitoring tools to unlock powerful hidden insights.

“We’ve given our heaviest software builders back 15 hours every 2 weeks. We consider this a $100 million dollar problem.”
Tableau

Custom reporting in action
Check out three ways you can use Develocity as a platform to generate unique insights and augment your productivity business intelligence.
API
The API allows you to extract build and test data from your Develocity instance—enabling you to push this data into other systems and use it to build reports and dashboards. With its event-based approach you can also monitor and react in real time to build and test events.
Read DocumentationOptimize CI Resource & Cost Efficiency
Manage CI build throughput demand, given available compute resource and cost constraints, using build performance acceleration and failure monitoring and resolution technologies.
Cost Avoidance
Avoid running components of builds and tests unnecessarily by leveraging Build Cache and Predictive Test Selection performance acceleration technologies.
Resource Profiling
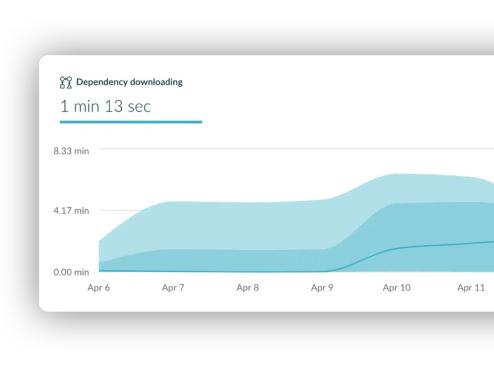
Leverages Build Scan® to identify build actions that put the most load on your CI infrastructure so efforts to reduce loads have the highest impact.
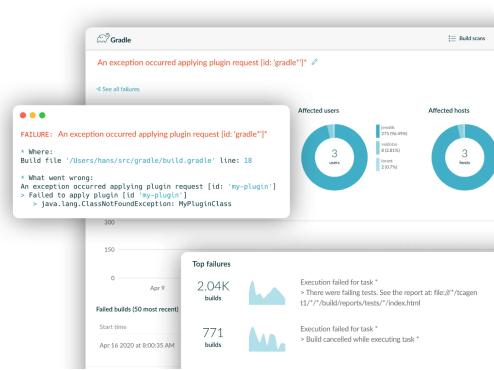
Failure Prevention
Use Failure Analytics to minimize avoidable failures like flaky tests that consume resources and cause builds to be run multiple times.
See Develocity in action
Get the high-level business case for investing in Develocity. Our demo video walks you through the major solution capabilities, describes their key benefits, and demos real-world practical examples of powerful features that address your top developer productivity pain points.
