Discover the only event dedicated to Developer Productivity Engineering and Developer Experience—September 24-25 in San Francisco.


Management Reporting & Insights

Management Reporting & Insights leverages Develocity analytic dashboards to capture and share status and outcomes for an organization or a team’s DPE initiative, such as progress against historical build performance and failure data and trends. This new level of observability can be used to justify the current investment level or additional investment. It can also be used to share quantifiable progress and outcomes with both management stakeholders and peer teams in other business units.
Benefits of Management Reporting & Insights
 |
 |
 |
|
| Measure and prove the value of DPE | Report and share business outcomes | Continuously improve DevProd and DevX | |
| For software engineering management | Measure the value and monitor the outcomes of DPE initiatives to justify ongoing investment and to cultivate or maintain C-level management support. | Deepen dev team productivity, cost, and quality reporting by integrating DPE initiative data and metrics into higher-level business intelligence dashboards. | Establish an always-learning and continuous-improvement culture using insights gained from historical trend data to measure progress and drive a more proactive approach. |
| For dev team and productivity/platform leaders | Prove the value of DPE to management, peer teams, and stakeholders, and increase the incentive of productivity engineers to take up the challenges since they now have reliable tools to measure their impact. | Provide observability of outcome metrics and trends like build performance regressions so that reporting on deviations from actual and historical performance is easier to do. | Proactively address potential problems leveraging observability and trend data to get out of firefighting mode and build a proactive culture that focuses on problem prevention rather than troubleshooting. |
Performance Reporting & Insights for Managers
Performance Reporting & Insights is enabled by the Develocity Performance and Trends Dashboards. They provide intuitive presentations and visualizations of build and test performance data and key metrics for both local and CI builds. Key features include:
 |
Observability to key performance metrics
For the first time you can get quick access to some fundamental data points, such as # of builds executed over a specified time period and aggregated build execution time; serial execution time (for assessing the strength of your parallelism implementation); savings from reduced feedback cycle time; and cache overhead; dependency download time. |
 |
Performance metric filtering
All above metrics can be filtered for arbitrary subsets of builds. For example, you can filter by specific user, specific projects, local vs. CI builds, builds from a specific branch, builds of a particular type, local builds with changes not yet committed to version control and many other criteria. |
 |
Drillable performance trends
You can also see the performance trends for every test class and every test method or test method subset. By using custom values, you can filter by the same powerful criteria to find, for example, performance differences between locations or hardware configurations. |
 |
Derived performance metrics
With ready access to standard metrics, you can easily derive additional metrics and KPIs of interest like the total developer wait time for local or pull request builds to complete and associated aggregate costs. You can also use custom values and tags to compare metrics between different locations and different hardware configurations. |
 |
ROI/value quantification
In practical terms, it’s easy to quantify the value of wasted R&D investment due to unnecessarily slow builds or the value of shaving one minute off the average build time in terms of engineering years or additional R&D budget. For even a moderate-sized project these numbers are often eye popping. |
 |
Scalable data store
S3 disk storage provides a cost-effective solution for storing massive amounts of data that can be leveraged in mining for insight and trend patterns. |
Performance Reporting & Insights (Trends Dashboard) In Action
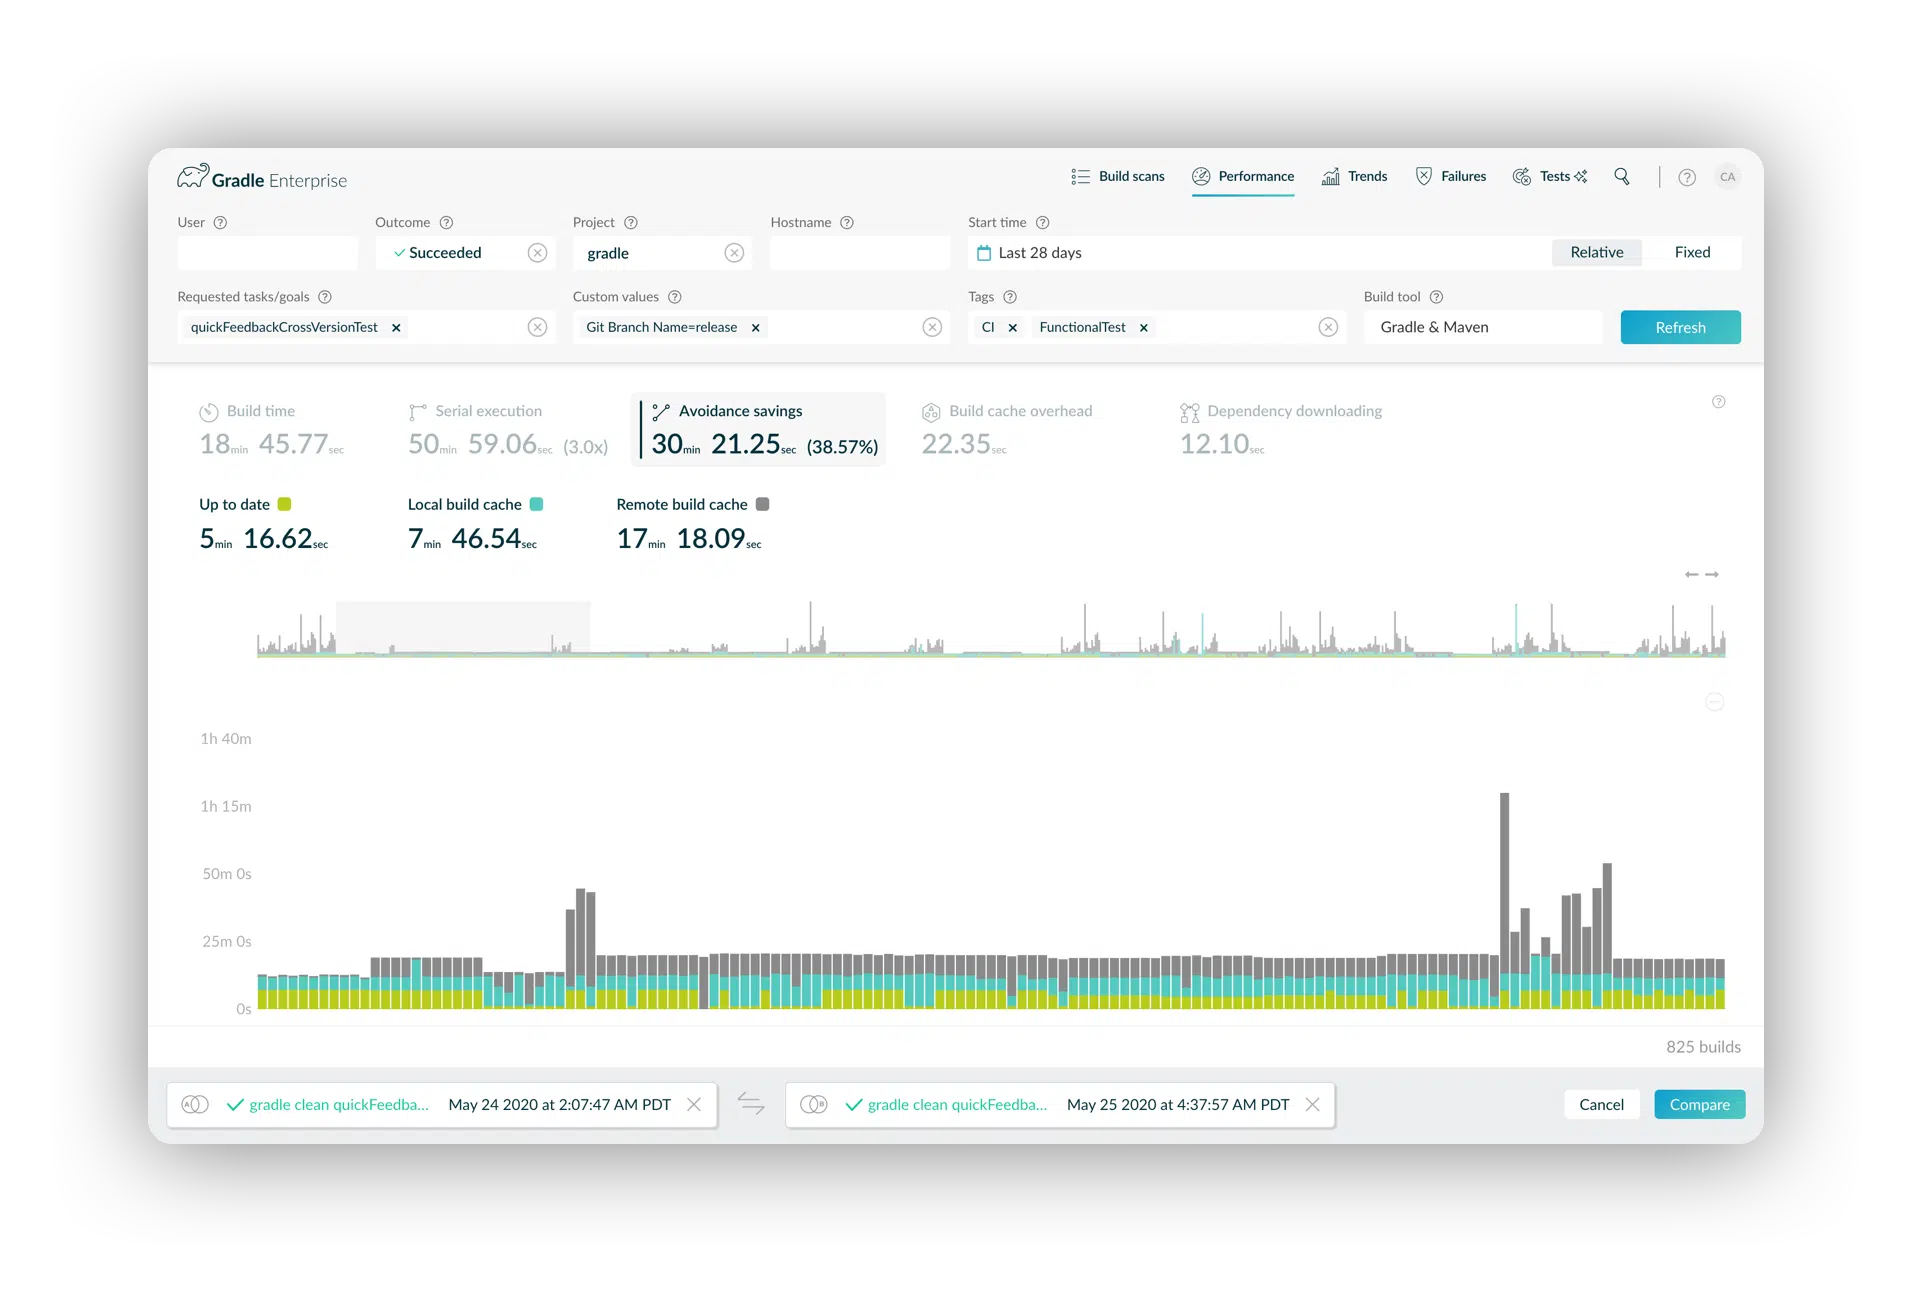
The performance dashboard allows you to identify slow builds then compare them to healthy ones to avoid unnecessary developer waiting.
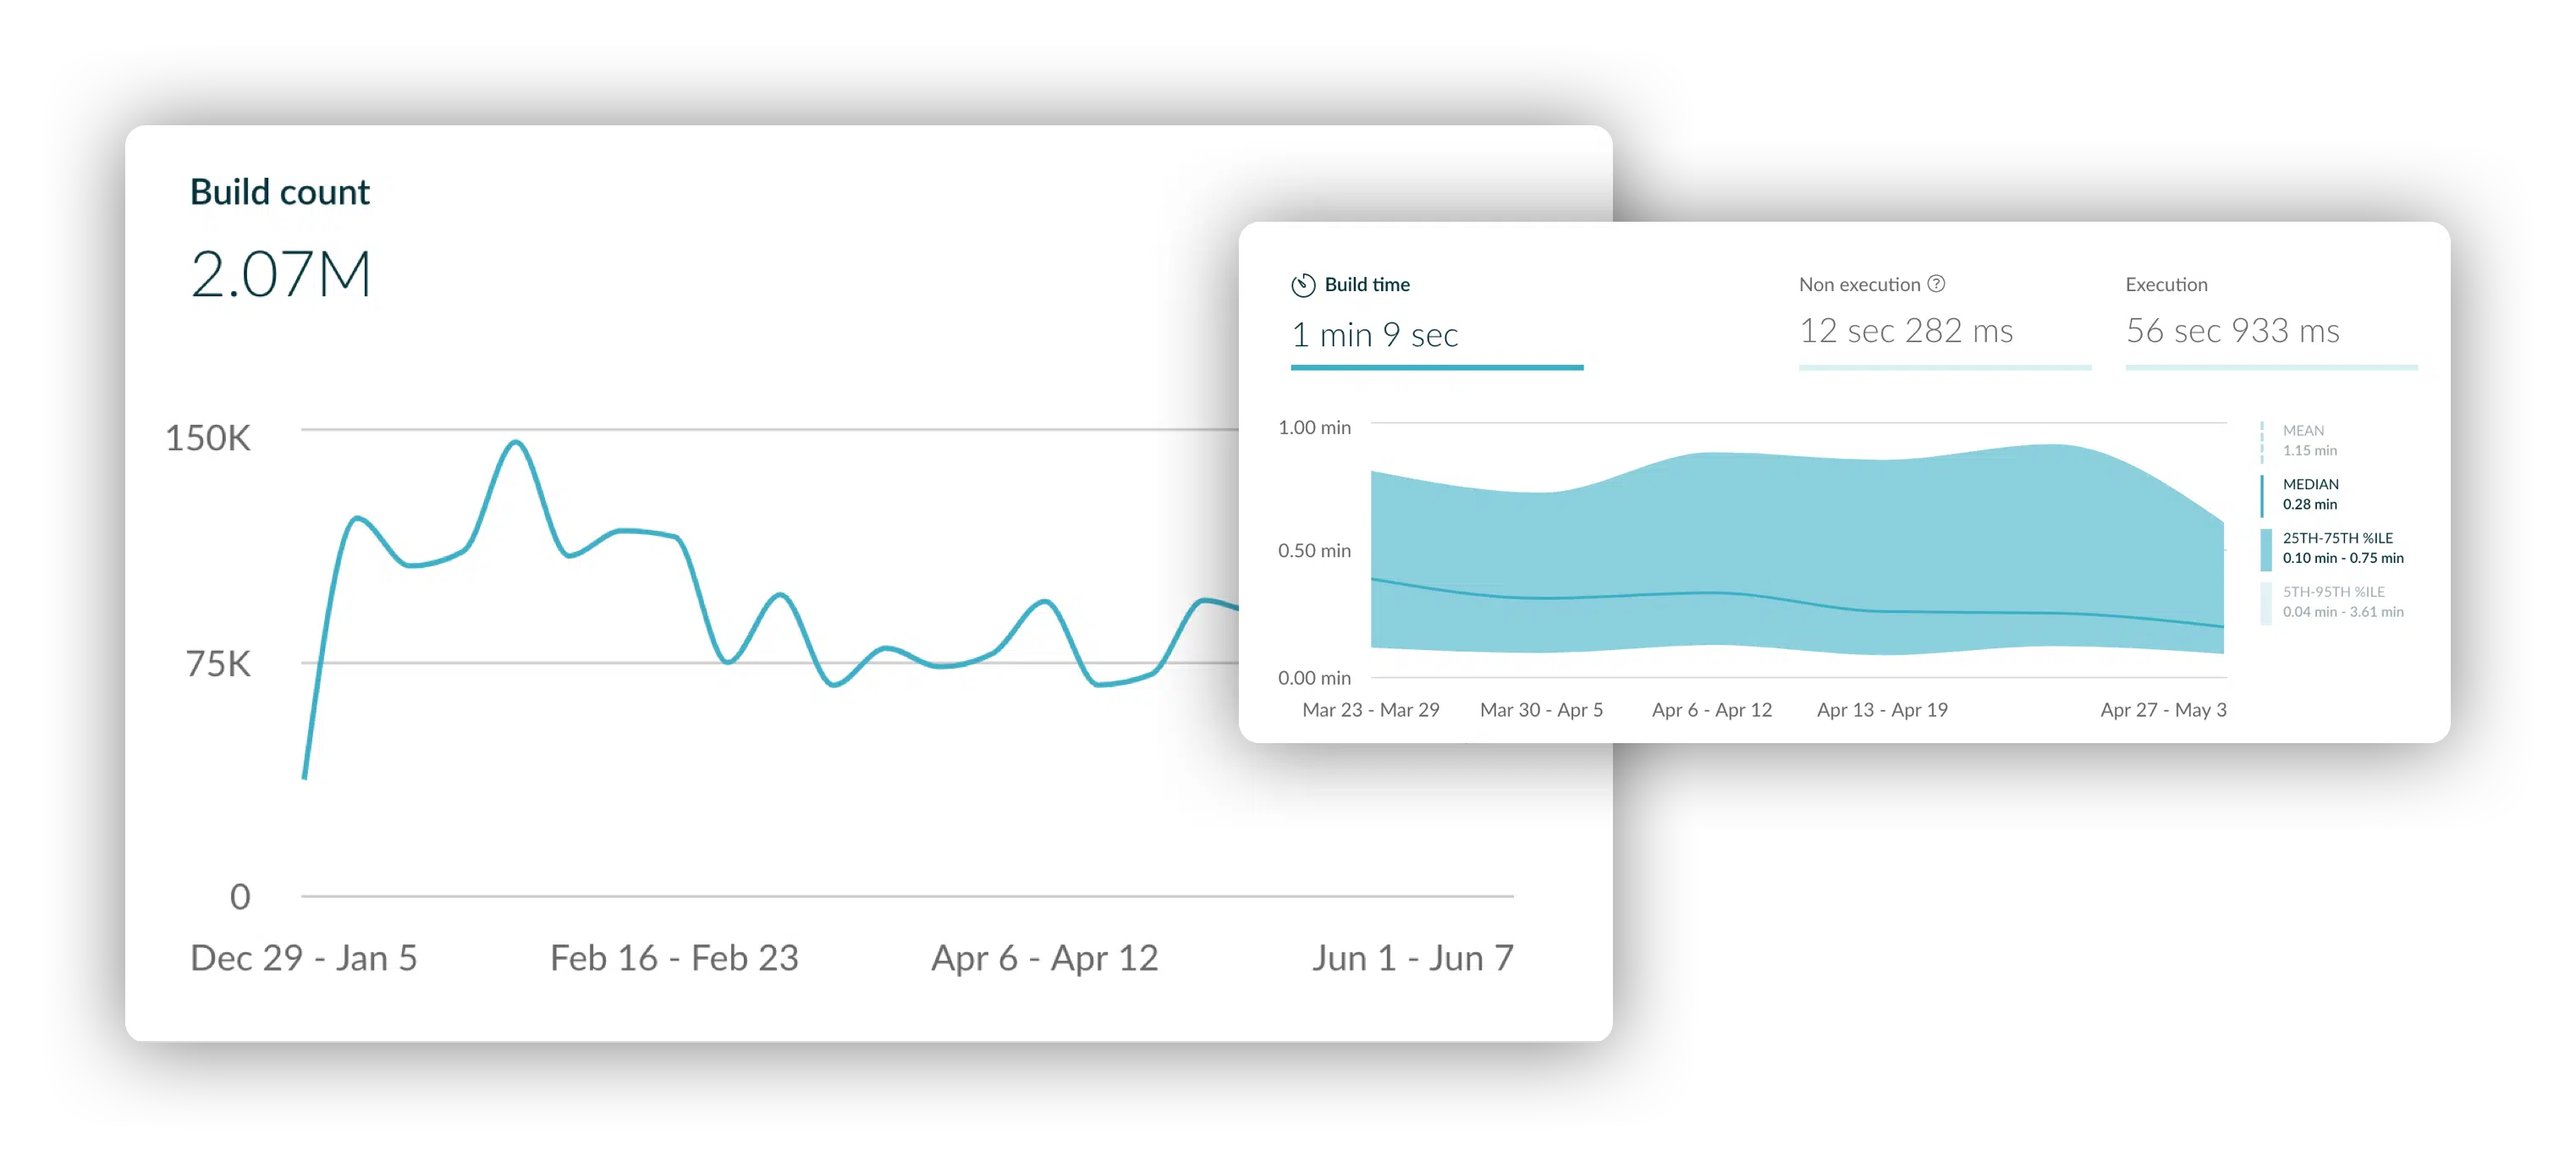
Modern software teams run millions of builds per month. Small improvements add up to massive productivity gains.
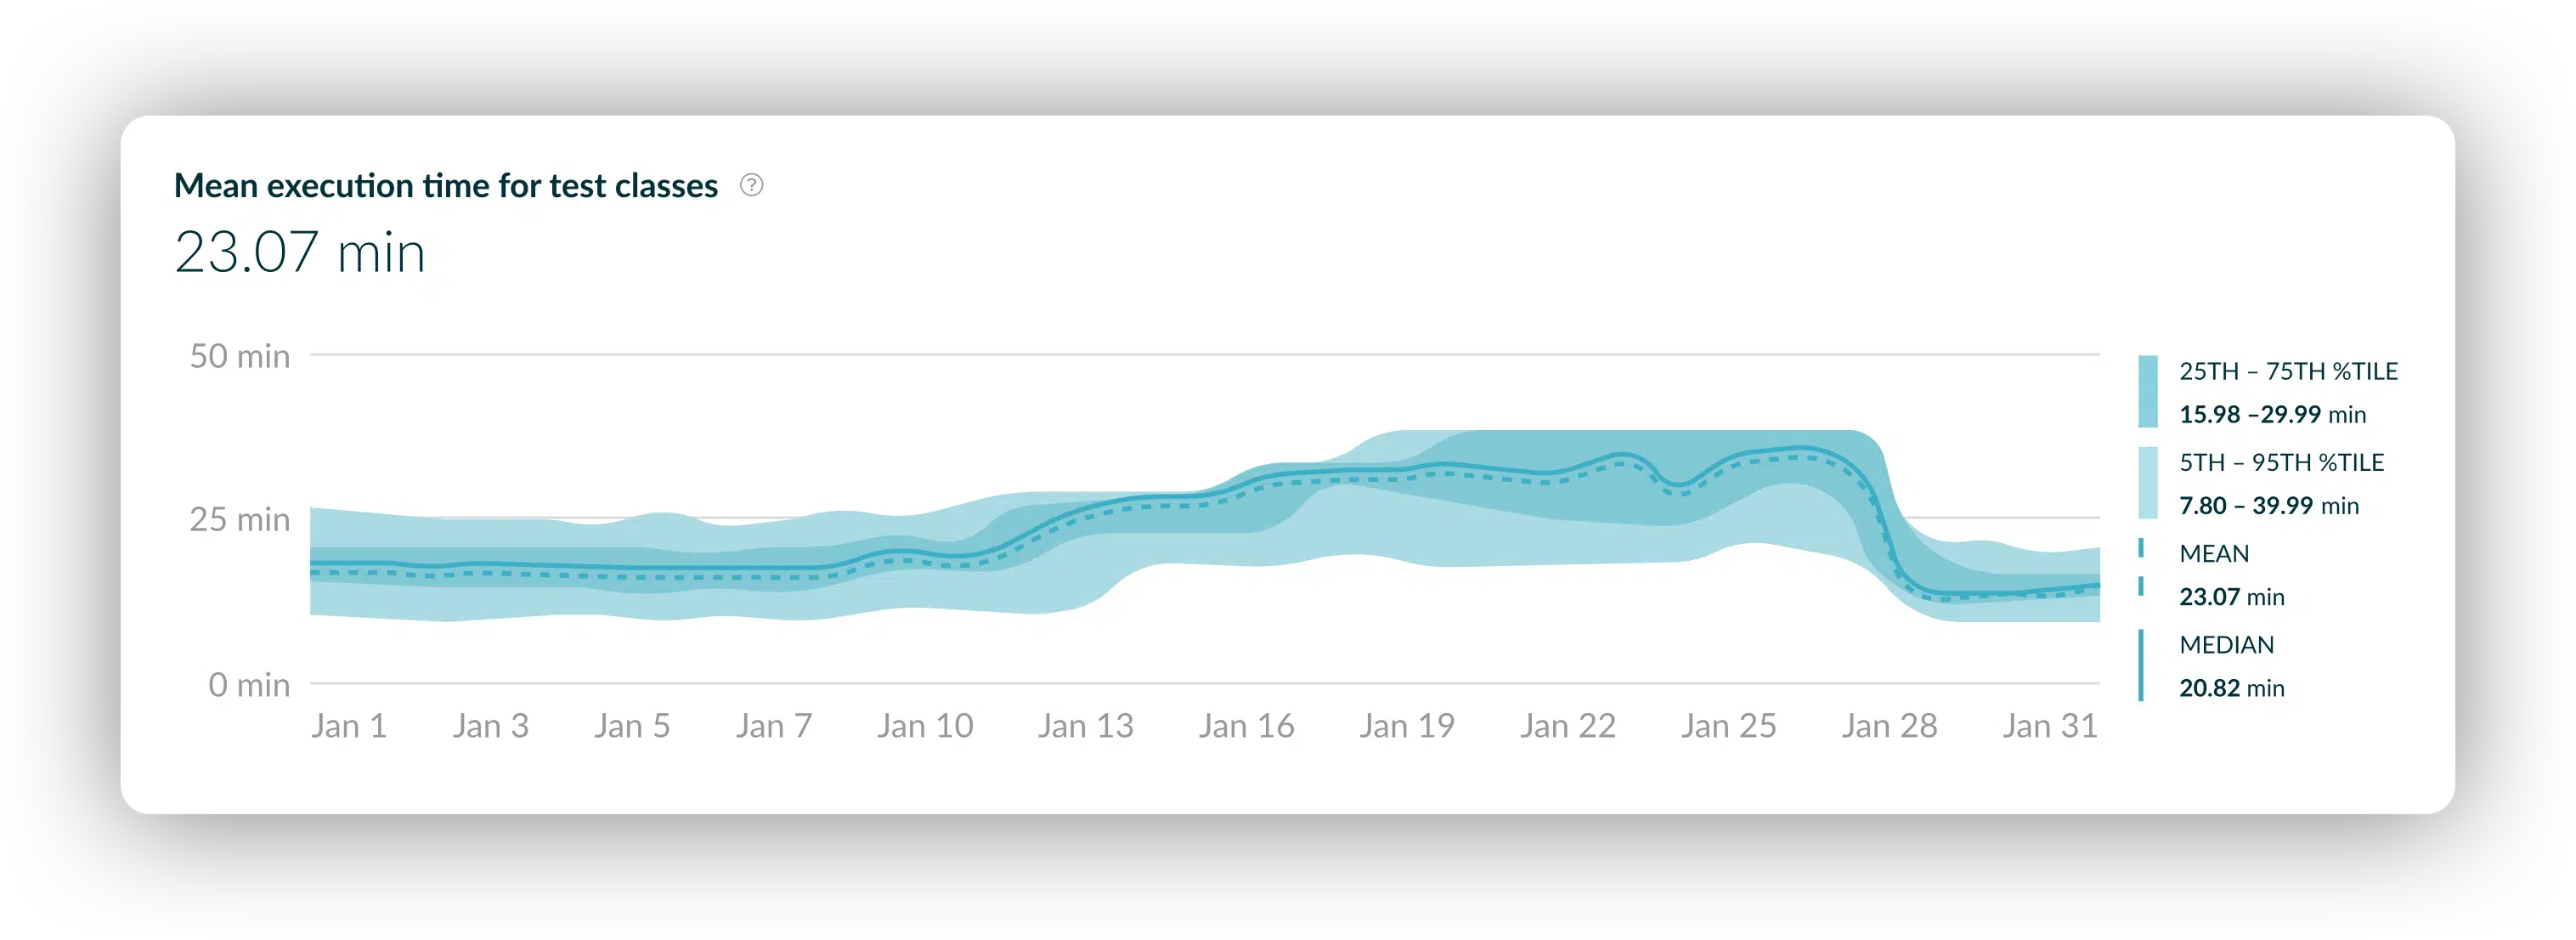
Real world example at Elastic: This dashboard revealed an anomalous execution time regression for test classes starting January 13. This launched an investigation and the remediation was in place by January 28. You can see that the new baseline not only validated the fix, but demonstrated that the impact of the fix was to improve the performance compared to the original baseline.
Failure Reporting & Insights for Managers
The Failure Reporting & Insights capability consists of the Build Failure Analytics Dashboard and the Test Failure Analytics Dashboard. They are used to observe, analyze, and report on flaky test and other avoidable test failure patterns. And they provide visibility to both local and CI builds. Further, these dashboards can chart trends for build and test stability broadly (e.g., across your entire organization) or very precisely (e.g., an exact error message for a single project, build agent, and git branch). Should a problem ever reoccur, historical data will quickly show you the timeline and failure patterns to dramatically speed up average resolution time. Key features include:
|
Observability to key failure metrics
For the first time you can get quick access to some fundamental data points that can facilitate toolchain improvements. These may include (1) build and test failure rates, (2) test flakiness, (3) frequency of specific failures, (4) user and host failure impact analysis, (5) time-to-failure, (6) verification (e.g., syntax failures) vs. non-verification (e.g. infrastructure) failure ratios. |
|
Failure metric filtering
All above metrics can be filtered for arbitrary subsets of builds. For example, you can filter by specific user, specific projects, local and CI builds, builds from a specific branch, builds of a particular type, local builds with changes not yet committed to version control and many other criteria. |
|
Drillable failure trends
You can also see the failure or flakiness trend for every build, task, test class, test method, or test method subset. This helps you navigate quickly to the data you need to address avoidable failures quickly. |
|
ROI/value quantification Failure statistics are visible as trends, making it easy to observe progress in making builds more reliable. For example, progress towards reducing the number of flaky tests is reflected in the Test Failure Analytics Dashboard until all are eliminated, while still preserving a visible history. This makes it easy to quantify the impact of your improvements and aids in prioritizing future improvement initiatives. |
Failure Reporting & Insights (Trends Dashboard) In Action
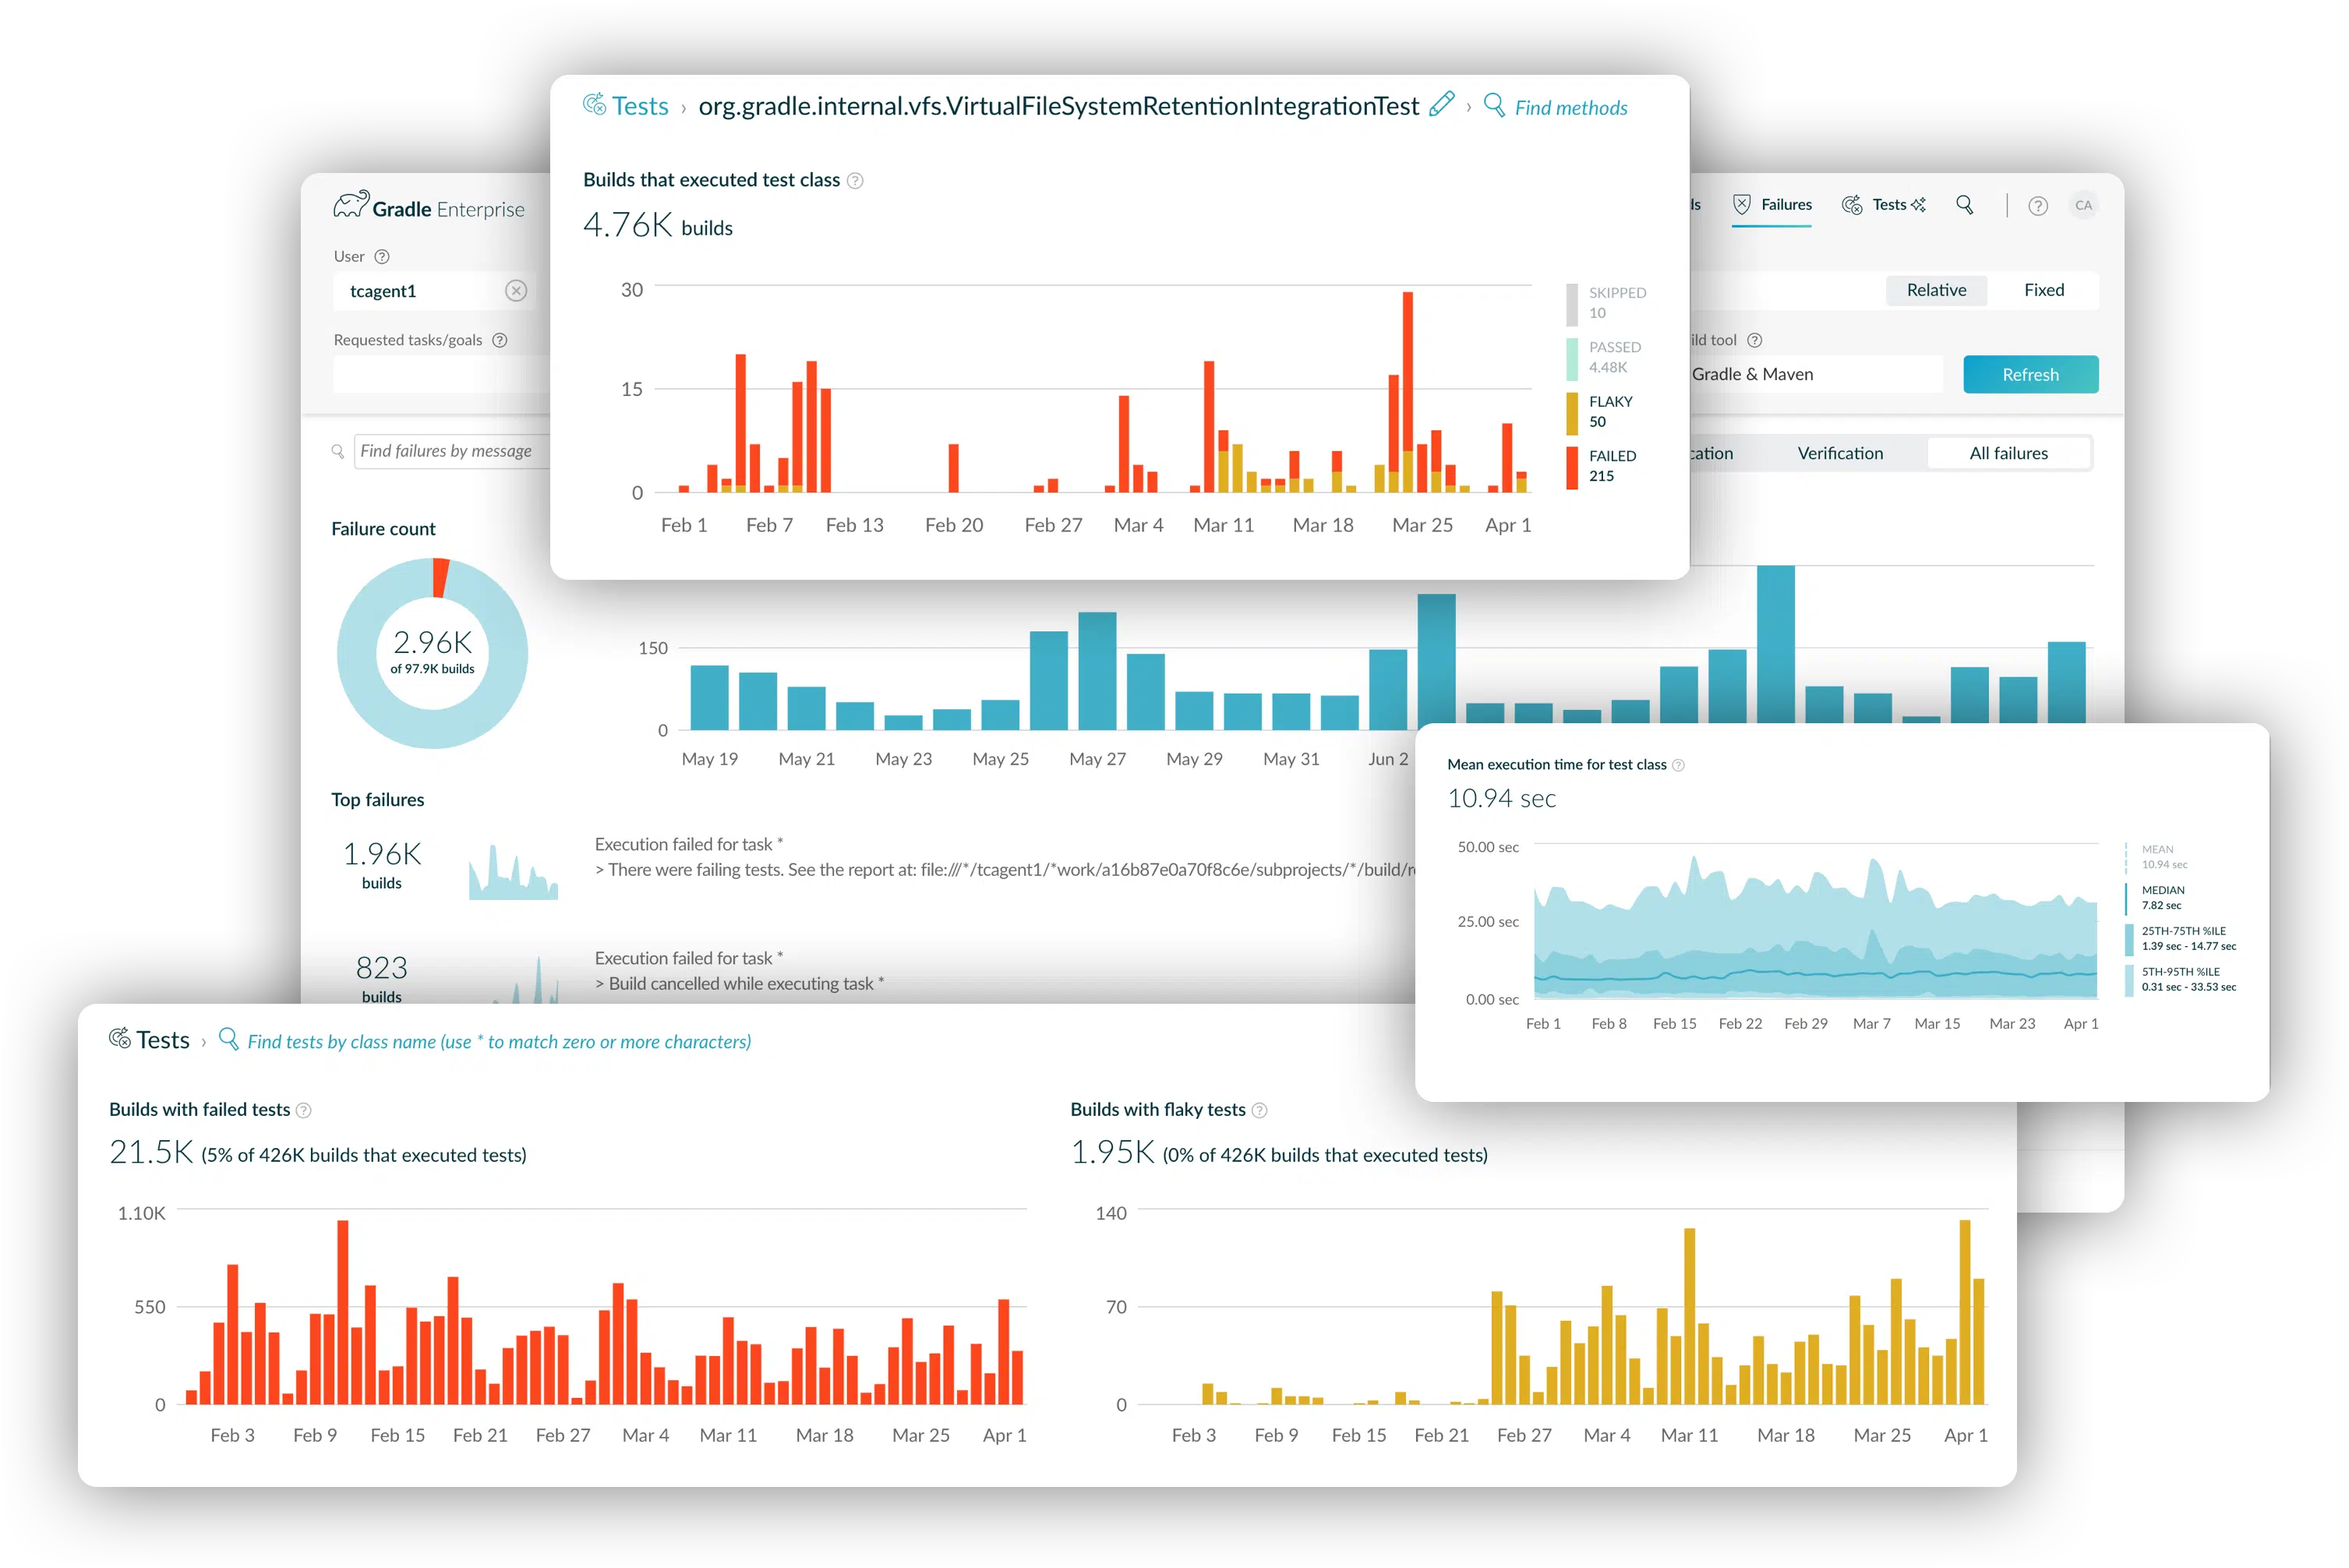
Build and test reliability trends tell you when things break so you can proactively and quickly fix problems.
API for Build and Test Insight Data
Our API provides the foundation for interacting with Develocity. It is defined using the OpenAPI specification and comes with sample code for data models and client applications. The API delivers metric, KPI and other Develocity data for easy integration with BI/reporting tools and monitoring systems. For example, some companies use Tableau as their system of record to consolidate data for reporting. With the API, you can include Develocity data in your dashboards. You can also use the API to analyze data from multiple builds beyond the features built into Develocity.


