Discover the only event dedicated to Developer Productivity Engineering and Developer Experience—September 24-25 in San Francisco.


Gradle Enterprise 2017.5
2017.5 adds a deeper performance breakdown to better understand where build configuration time is spent and more detailed build caching insights to understand how optimized current build cache usage is.
Read on for the details of the new features and improvements.
Use version 1.9 of the build scan plugin with this version of Gradle Enterprise for optimal build scans.
Highlights
Make build configuration time faster with script and plugin profiling
“Build configuration time” refers to the time taken for Gradle to understand enough about the build so that it can start executing the tasks requested. This involves executing build scripts and applying plugins. A slow build script or plugin has a significant negative impact on build usability by increasing the time between a Gradle build is invoked and when it starts performing the requested work.
The “Configuration” tab within the “Performance” section of a build scan now provides a detailed breakdown of the execution time of each script executed and plugin applied during configuration time, highlighting those that took the longest.
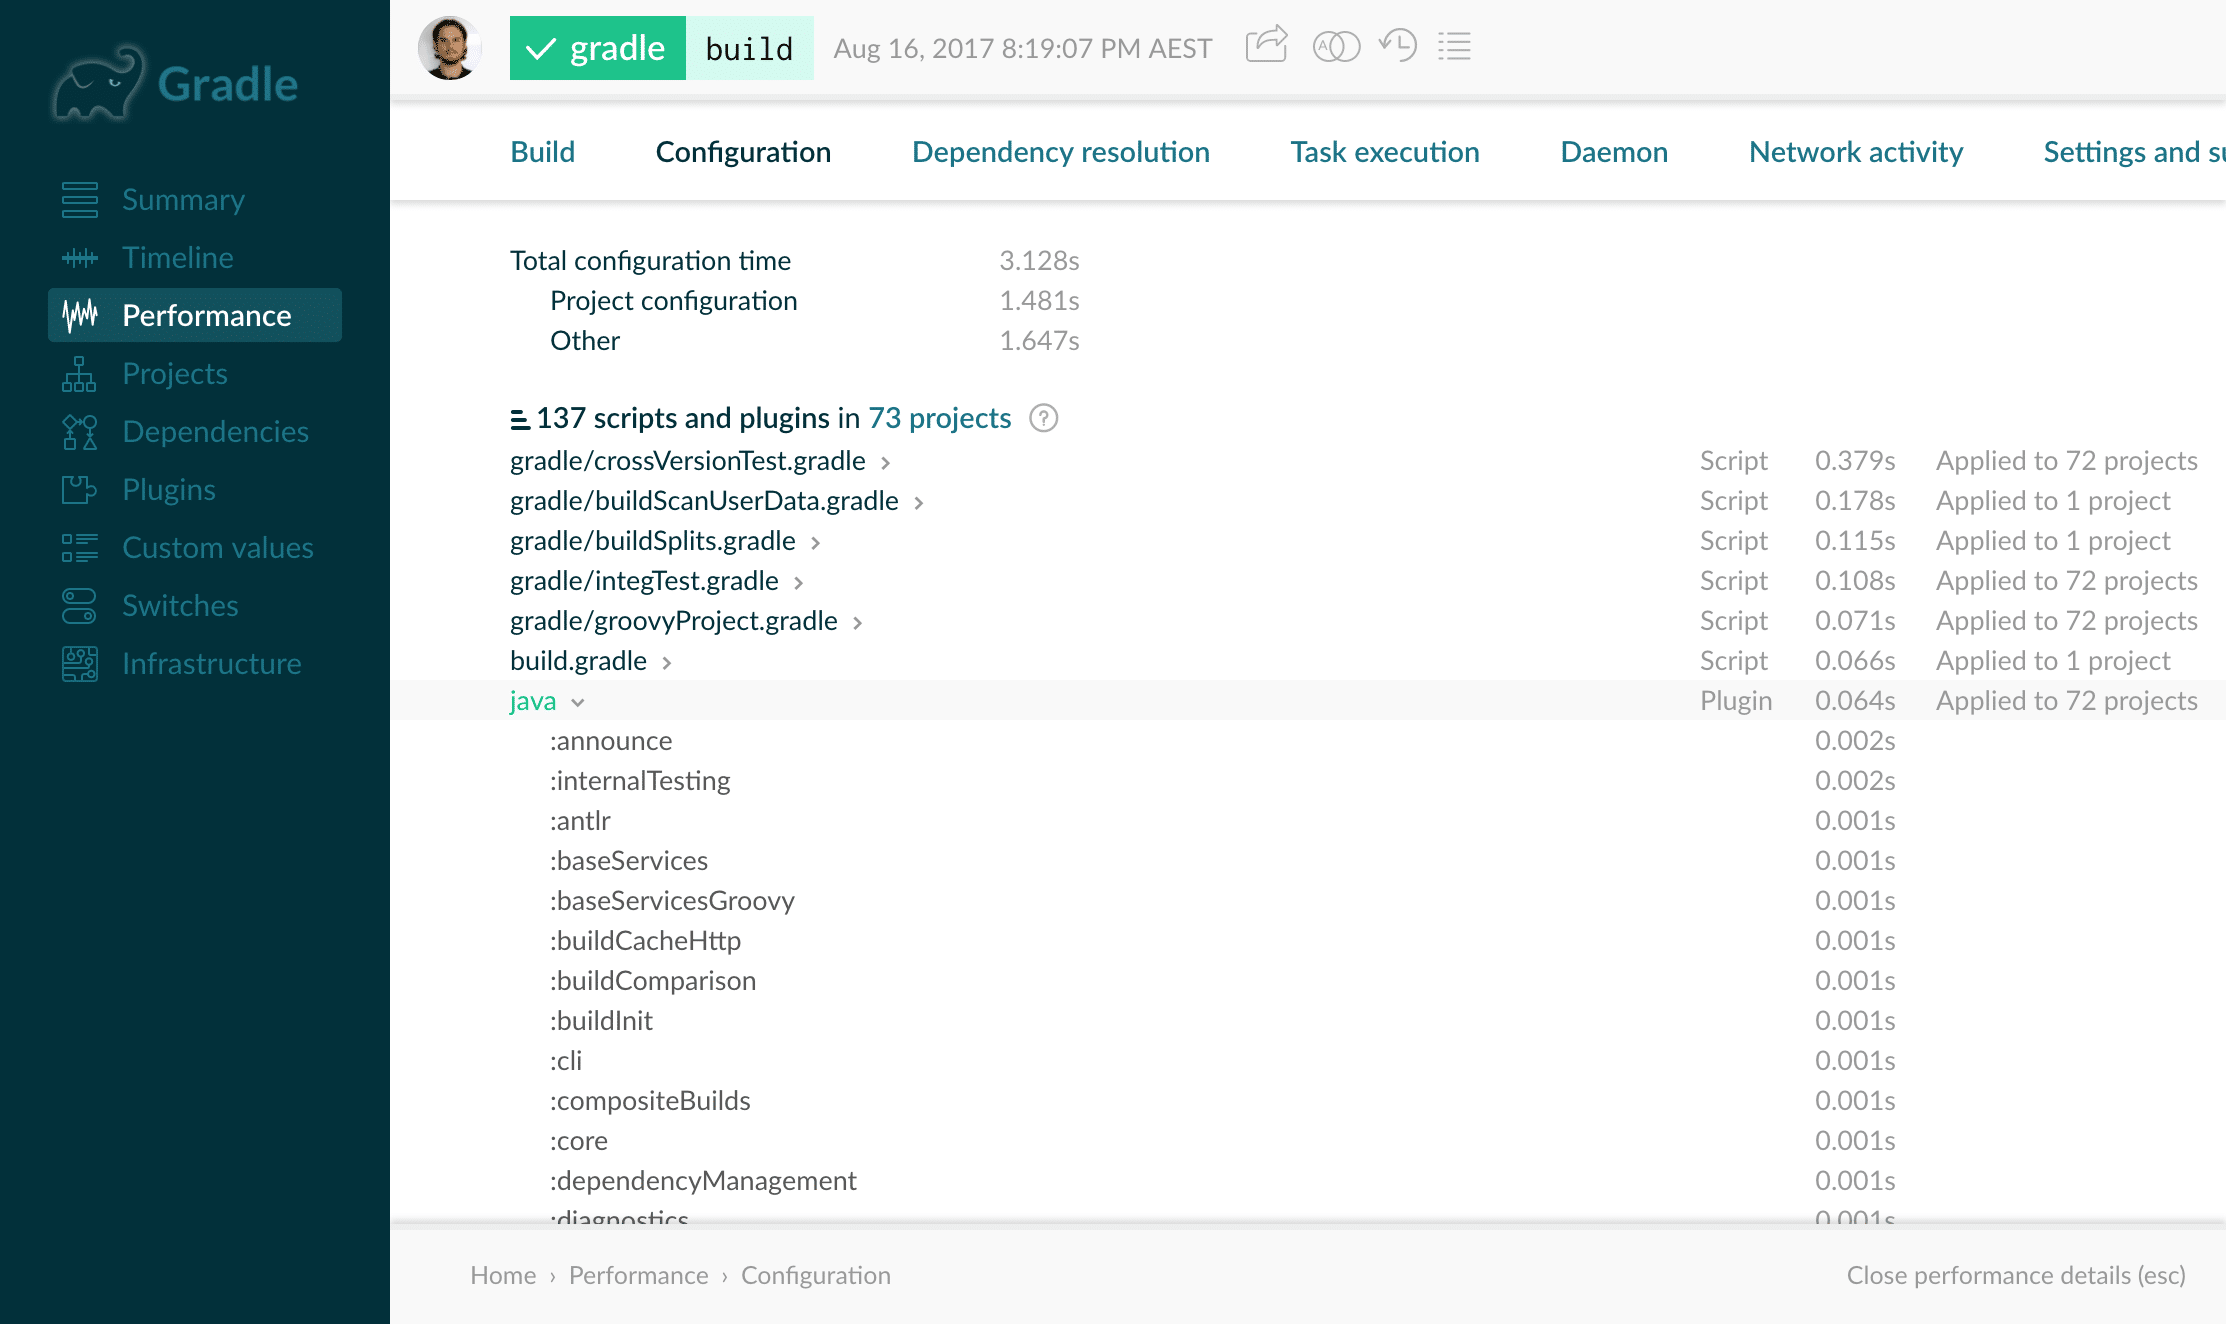
In multi-project builds, it is common for a script or plugin to be applied many times. This view shows the total time for all applications, as well as listing each individual application.
It is common for scripts or plugins to in turn apply other scripts or plugins. In a larger build, it may not always be obvious why a particular script or plugin is being applied. Click on an the icon next to an application of a script or plugin to see a “trace” to that application, effectively showing what caused that script or plugin to be applied.
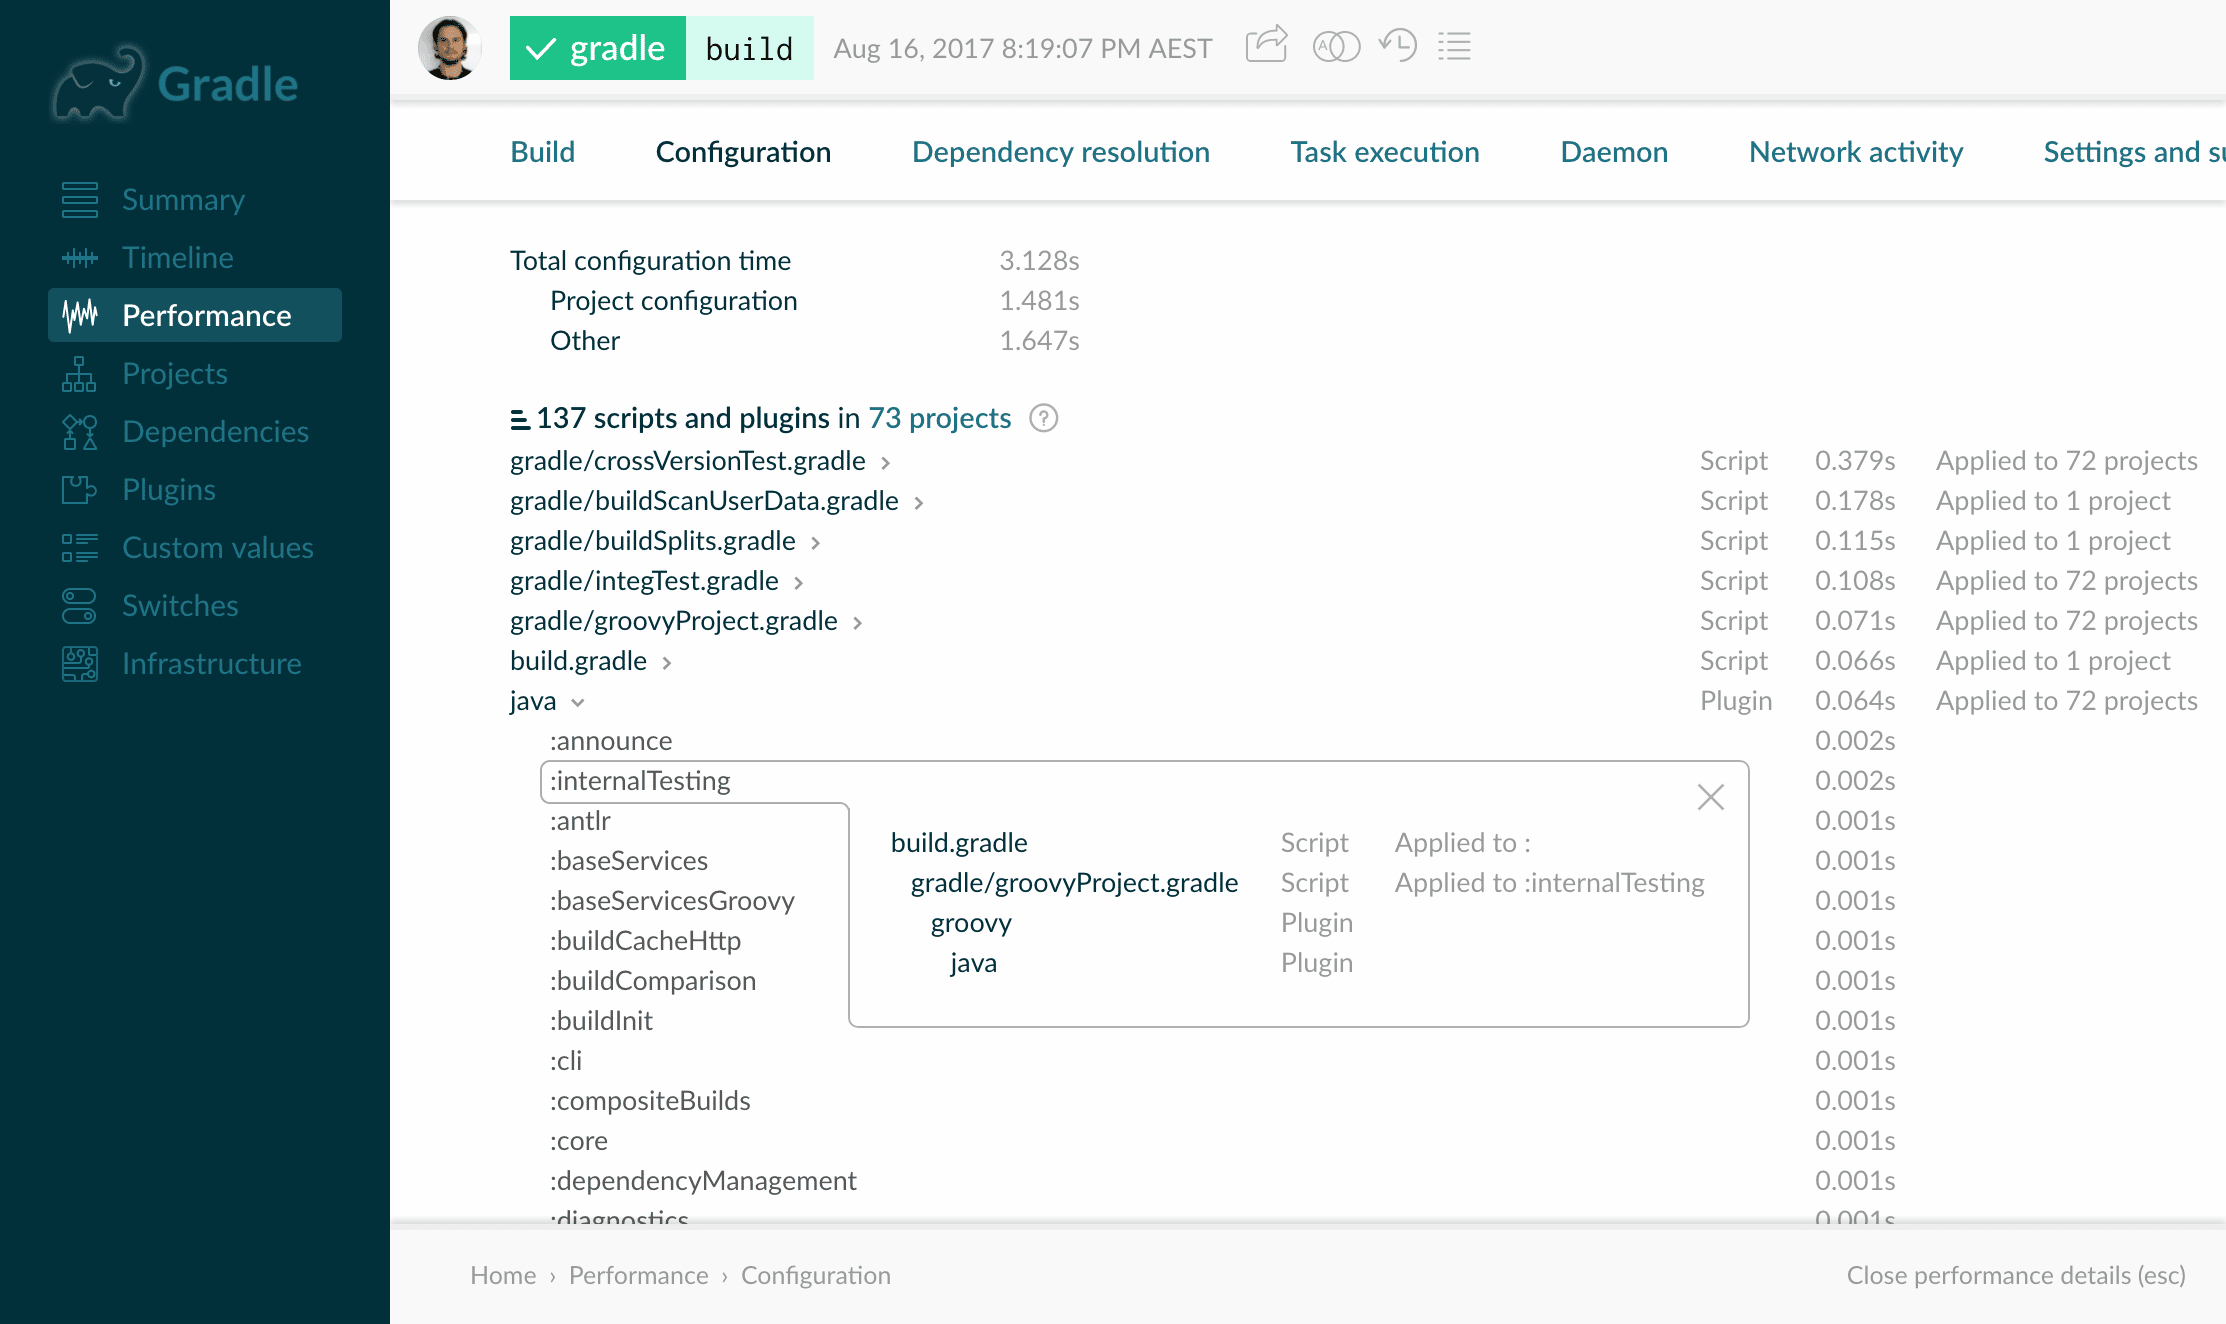
Use the configuration performance analysis to identify bottlenecks in your build configuration that require optimization, and to find unnecessary scripts and plugins that can be removed to improve your build speed.
Analyze and optimize build cache performance
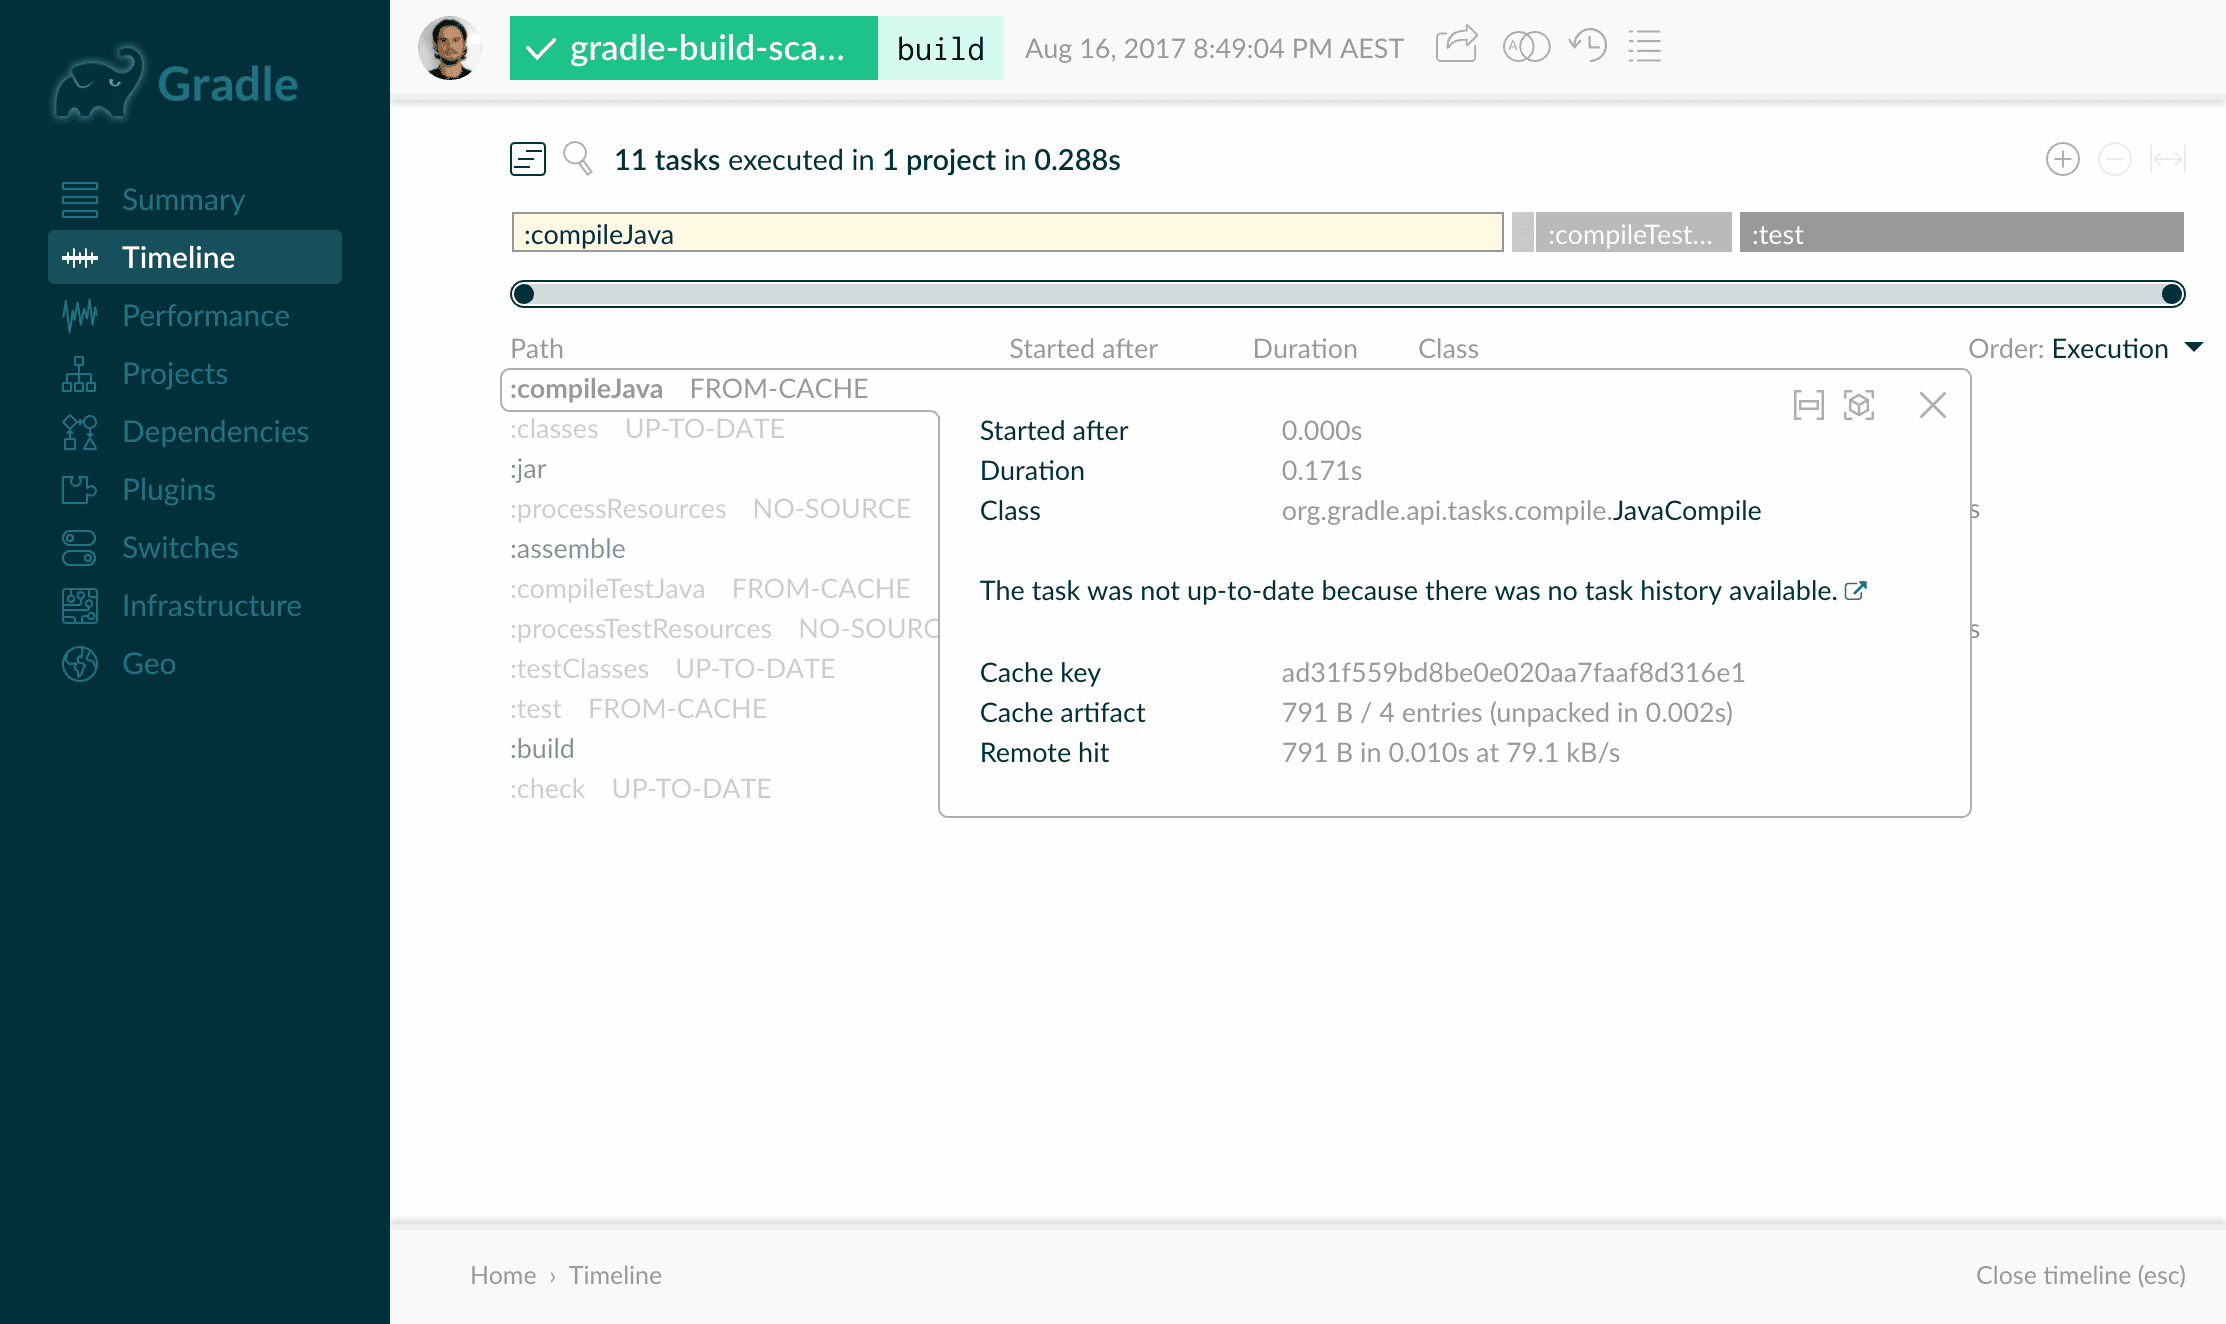
Gradle’s build caching feature makes builds faster by reusing the outputs of builds instead of building them again. The “Build cache” tab within the “Performance” section of a build scan (only visible when build caching is enabled) now provides a listing of each build cache interaction, along with the build cache configuration for that build.
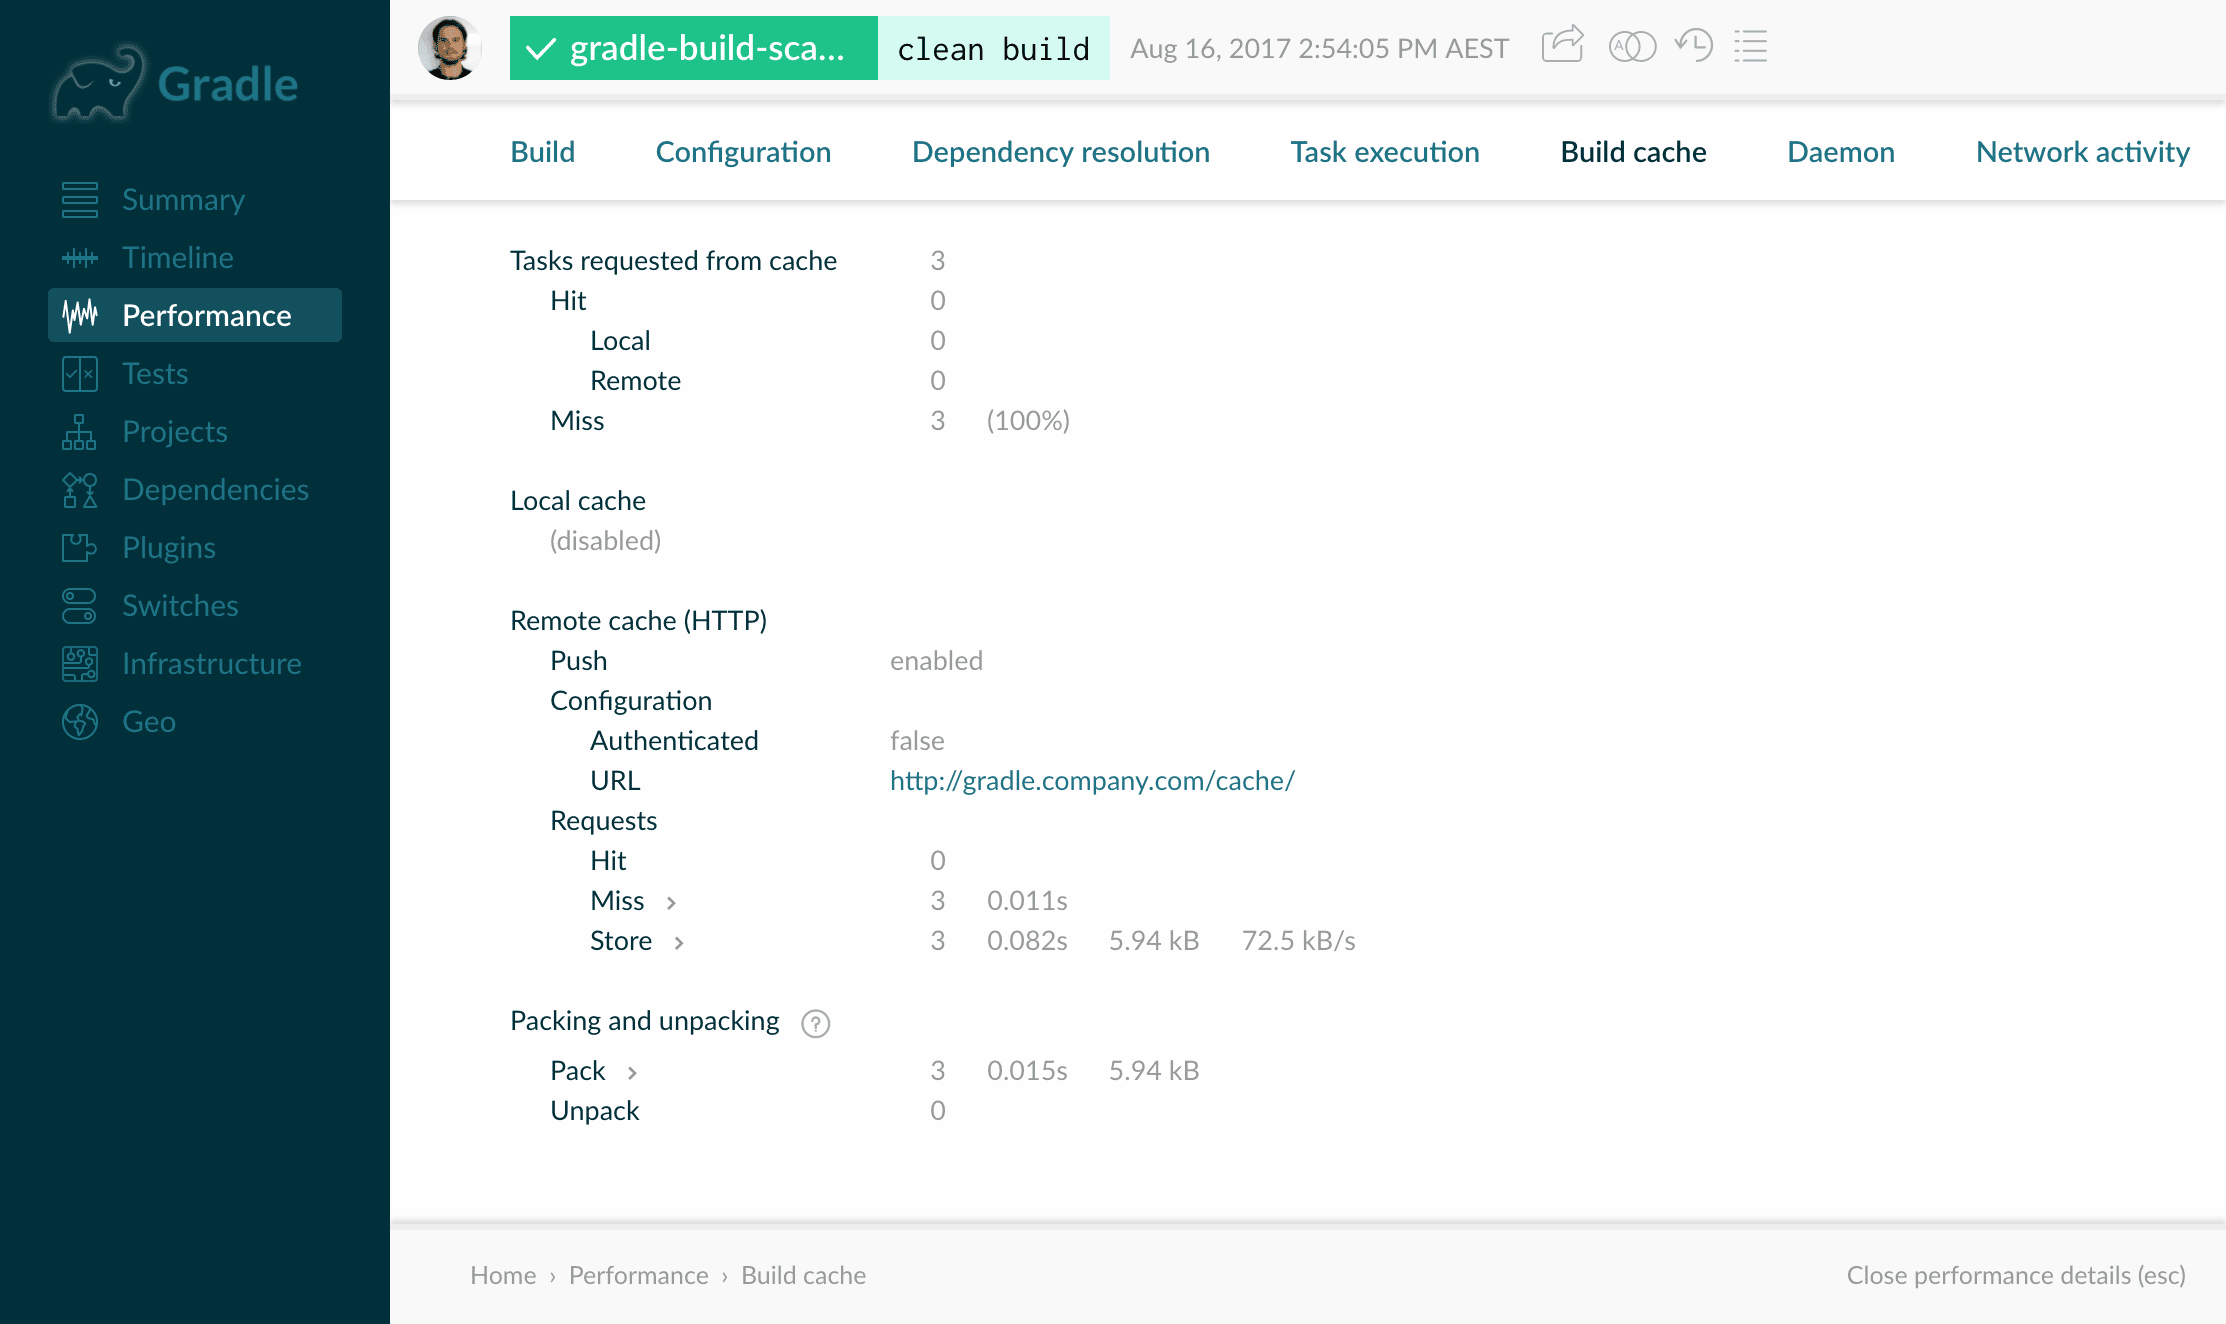
This information is particularly useful when using the remote cache provided by Gradle Enterprise, as the time taken for each cache request is shown along with the effective data transfer rate. This can be used to identify and diagnose scenarios in which using the build cache does not improve build performance due to the network transfer cost (which can be remedied by deploying another cache node in closer proximity).
Additionally, if errors occur interacting with the remote build cache (e.g. network failure), they will be listed here.
The build cache interactions are now also shown as part of the individual task details within the “Timeline” section.
Build scans are an essential tool for effective build cache usage.
Easily view and compare prior and subsequent builds
Local development builds generally happen within the context of prior and subsequent builds. From a build scan, you can now quickly and easily navigate to the build scans of prior and subsequent builds from the same workspace.
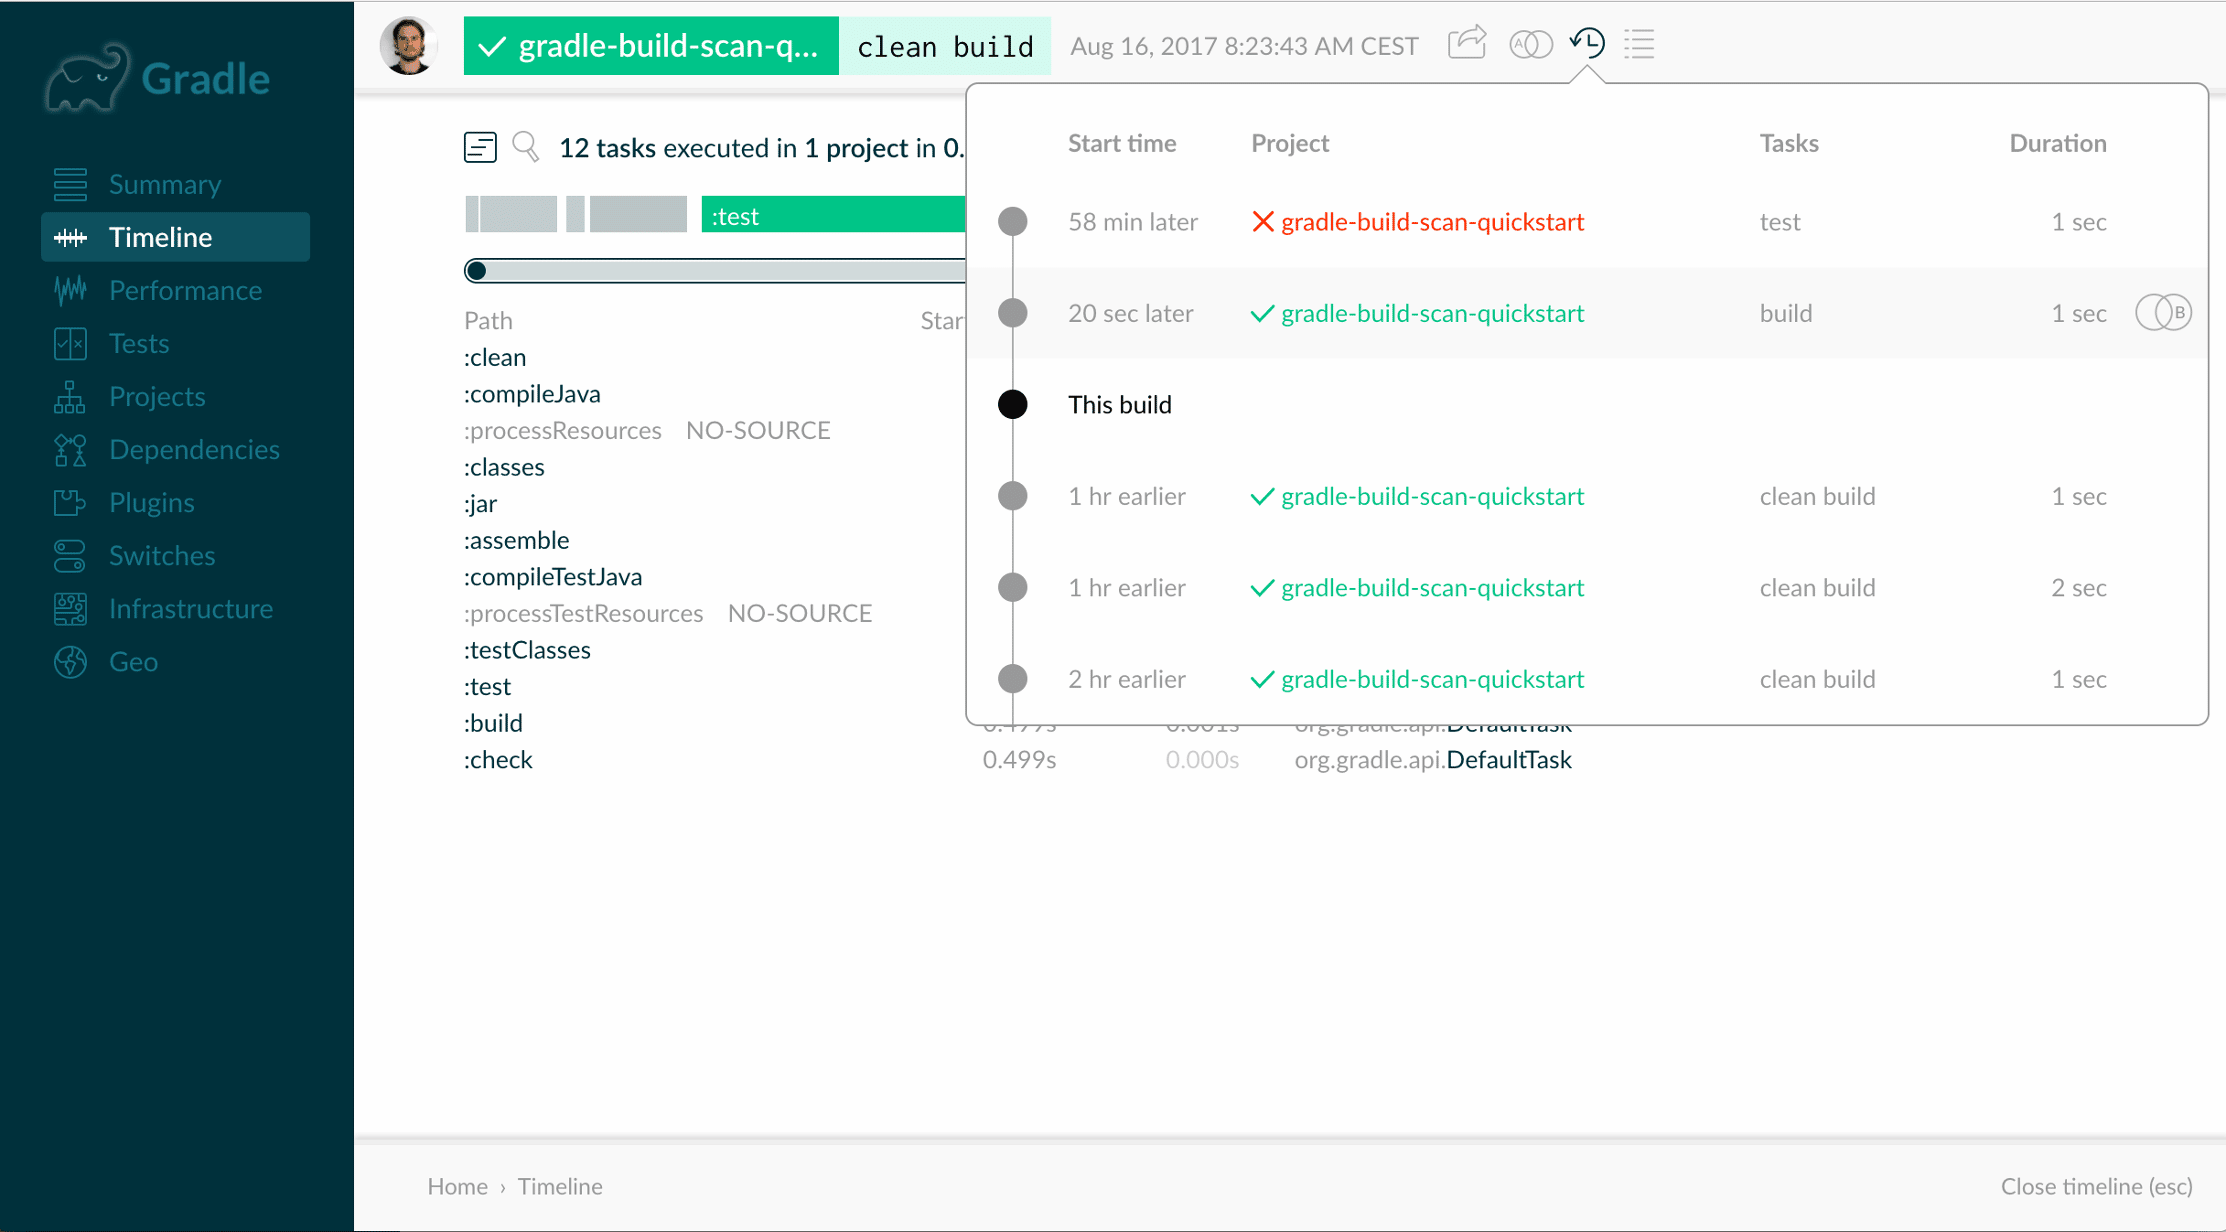
This makes comparing with a previous build much more convenient. It also provides a fast mechanism for understanding the series of builds that were run, which may highlight non-optimal build usage or incremental build configuration issues.
Upgrade notes
Several new build scan features in Gradle Enterprise require version 1.9 of the build scan plugin. Please upgrade your builds to use this version.
Changes
Sep 14, 2017
- [FIX] Build cache may evict more items than necessary
Sep 01, 2017
- [FIX] Server load temporarily spikes after performing update
Sep 01, 2017
- [FIX] Task details inspector displays erroneous build cache insights for some tasks
- [FIX] Build cache activity stats page displays erroneous task count in some cases
- [FIX] Build cache node settings are not correctly applied on restart
- [FIX] Connection to the export API stream may be closed unexpectedly
- [FIX] Export API data stream is buffered
Aug 24, 2017
- [FIX] Cache node configuration changes fail
- [FIX] Prior and subsequent builds cannot be opened in the background
- [FIX] Task details in timeline display cache operations chronologically
- [FIX] Individual items in comparison pages cannot be linked to
Aug 16, 2017
- [FEATURE] Identify slow configuration scripts and plugins
- [FEATURE] View details of individual build cache interactions
- [FEATURE] Easily view prior and subsequent builds of the same workspace
- [FEATURE] Filter custom values listed in build scan comparison
- [FEATURE] Access the scan list from a build scan via toolbar button
- [FIX] Comparing build scans with null custom values causes error
- [FIX] Hung build indexing workers should restart when Gradle Enterprise is restarted
- [FIX] Build cache activity stats page is slow to load when there is lots of activity
- [FIX] Build cache may contain empty artifacts after unplanned process termination
- [FIX] Remote build cache nodes cannot connect when it is password protected
- [FIX] Task timeline sometimes gets stuck when displaying tasks that took less than 1ms
- [FIX] Timeline page content jumps around as data is loaded
- [FIX] Dependency cycles are not correctly represented in the dependency details section
- [FIX] Blank values are shown in dependency resolution performance section when no dependency resolution occurred