Discover the only event dedicated to Developer Productivity Engineering and Developer Experience—September 24-25 in San Francisco.


Developer Productivity Engineering solutions for
CI & Platform Engineers
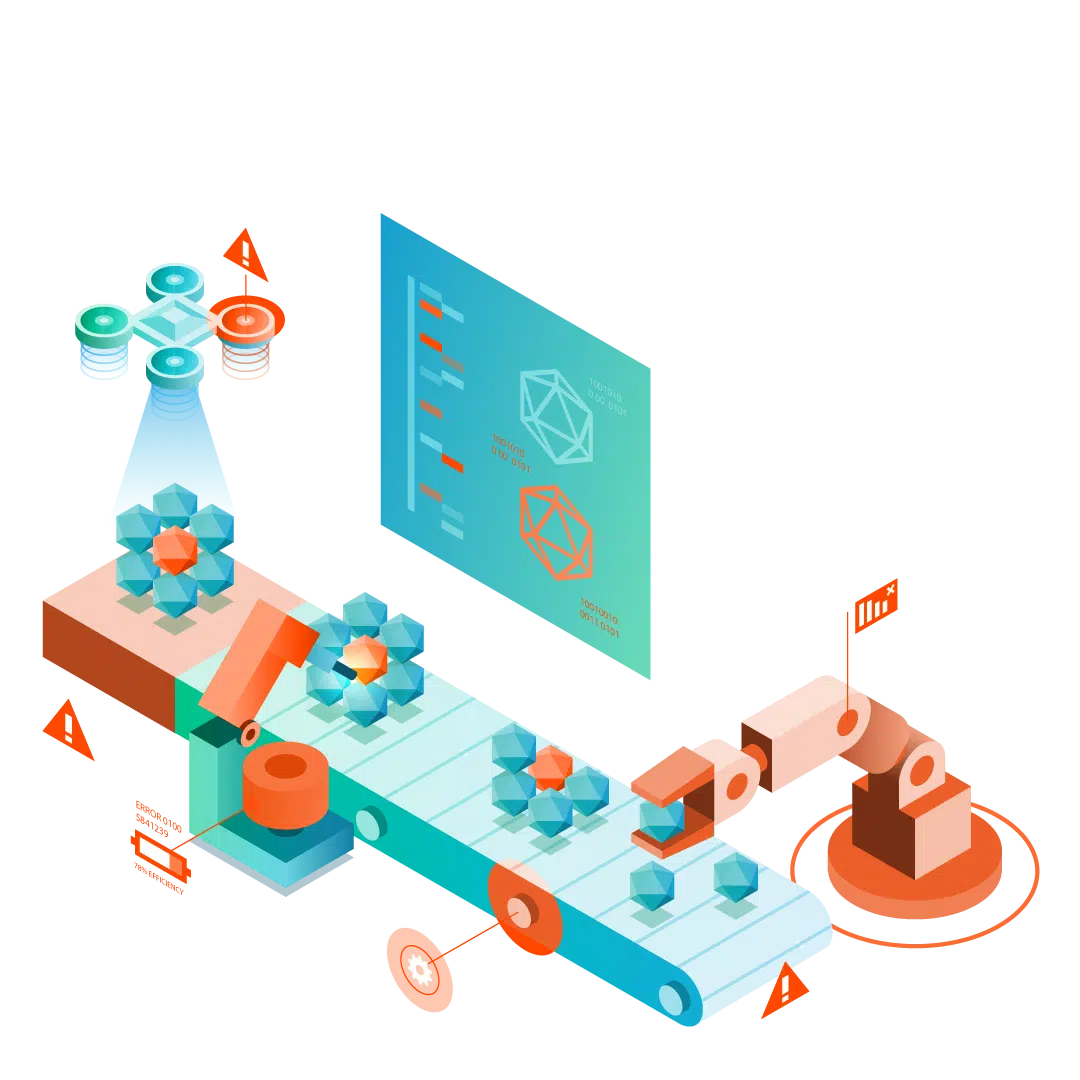
As a CI or platform engineer, your key responsibilities include maximizing CI pipeline throughput and cost efficiency, ensuring a quick recovery from failures, and continuously improving the reliability and efficiency of CI processes. Develocity provides pipeline acceleration, failure recovery, and CI observability and telemetry technologies to achieve your key CI quality-of-service metric goals.
Key Develocity Benefits for CI & Platform Engineers
Whether you are part of the CI team reporting into the application team with responsibility for builds or provide CI as a shared service that is generally not involved with builds, Develocity delivers benefits that help address your key challenges and pain points. They include the ability to:
Optimize CI pipeline throughput and build queuing time
Develocity performance acceleration technologies are designed to maximize CI pipeline throughput and minimize job queues given available compute resources. They are CI Build Cache, Predictive Test Selection, Test Distribution, and Performance Continuity. Used collectively, they provide a force multiplier effect to maximize and sustain pipeline throughput and keep your build queues under control.
Empower developers to self-service
The wealth of information in a Build Scan® tells developers exactly what happened during a build. How long did the build spend on each test? Which tests failed? Was a test failure in the test case or in the environment it ran in? Are there any flaky tests? Armed with this data, it’s likely your developers can fix problems on their own without turning CI into the developer help desk.

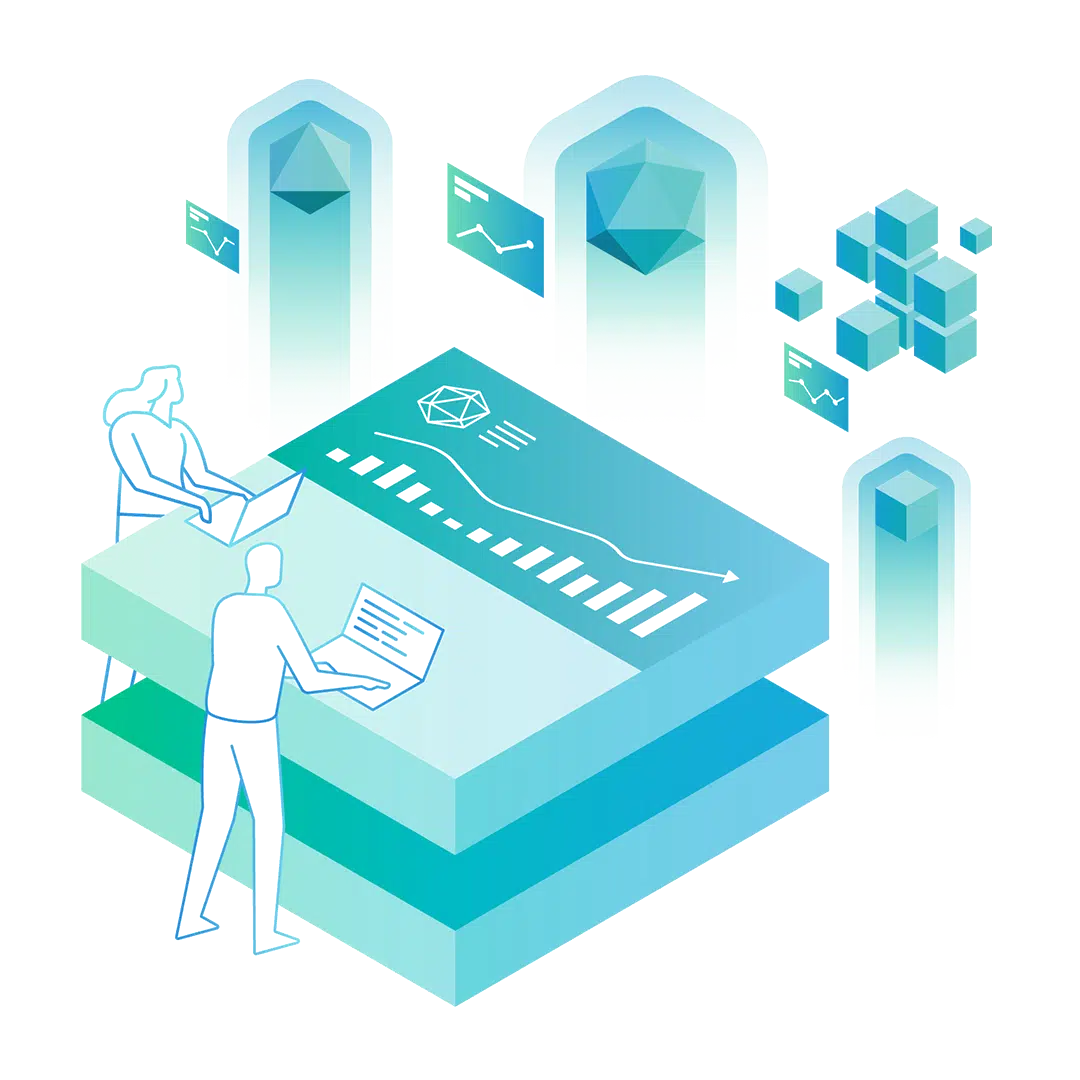
Get performance and test insights for every build
Existing build-time monitoring tools provide only high-level metrics like average build time. Develocity tells engineers exactly what happened during a build, such as time spent on each test, which tests failed or were flaky, and the cause of failure (test case or environment). Using our API you can combine this data with external data sources to discover additional performance and failure insights.
Use a trusted data signal to manage failure resolution
CI and devs now have the data to determine if errors are caused by their CI build environment and infrastructure or developer code, as well as the impact of failures, without reproducing the build data. This minimizes the number of unnecessary builds, freeing up CI system capacity, as dev and CI teams are confident that they are only working on problems they are responsible for solving and in the right priority order.

Observe Performance Trends locally and on CI
Without this insight, your builds can become increasingly slower and error prone as your codebase grows and changes. That degraded performance represents invisible, build-related technical debt. Develocity makes it easy to get local build experience visibility (e.g. Artifactory issues) , so you can proactively help improve build performance before your developers complain.
Operate efficiently within cost constraints
Develocity build and test performance acceleration and continuity solutions enable you to optimize the speed of CI builds given compute resource and cost constraints. For cloud-hosted services based on elastic usage-based pricing, this translates directly and proportionately into lower bills. For internal CI teams, this means growing demand can be handled with existing resources.
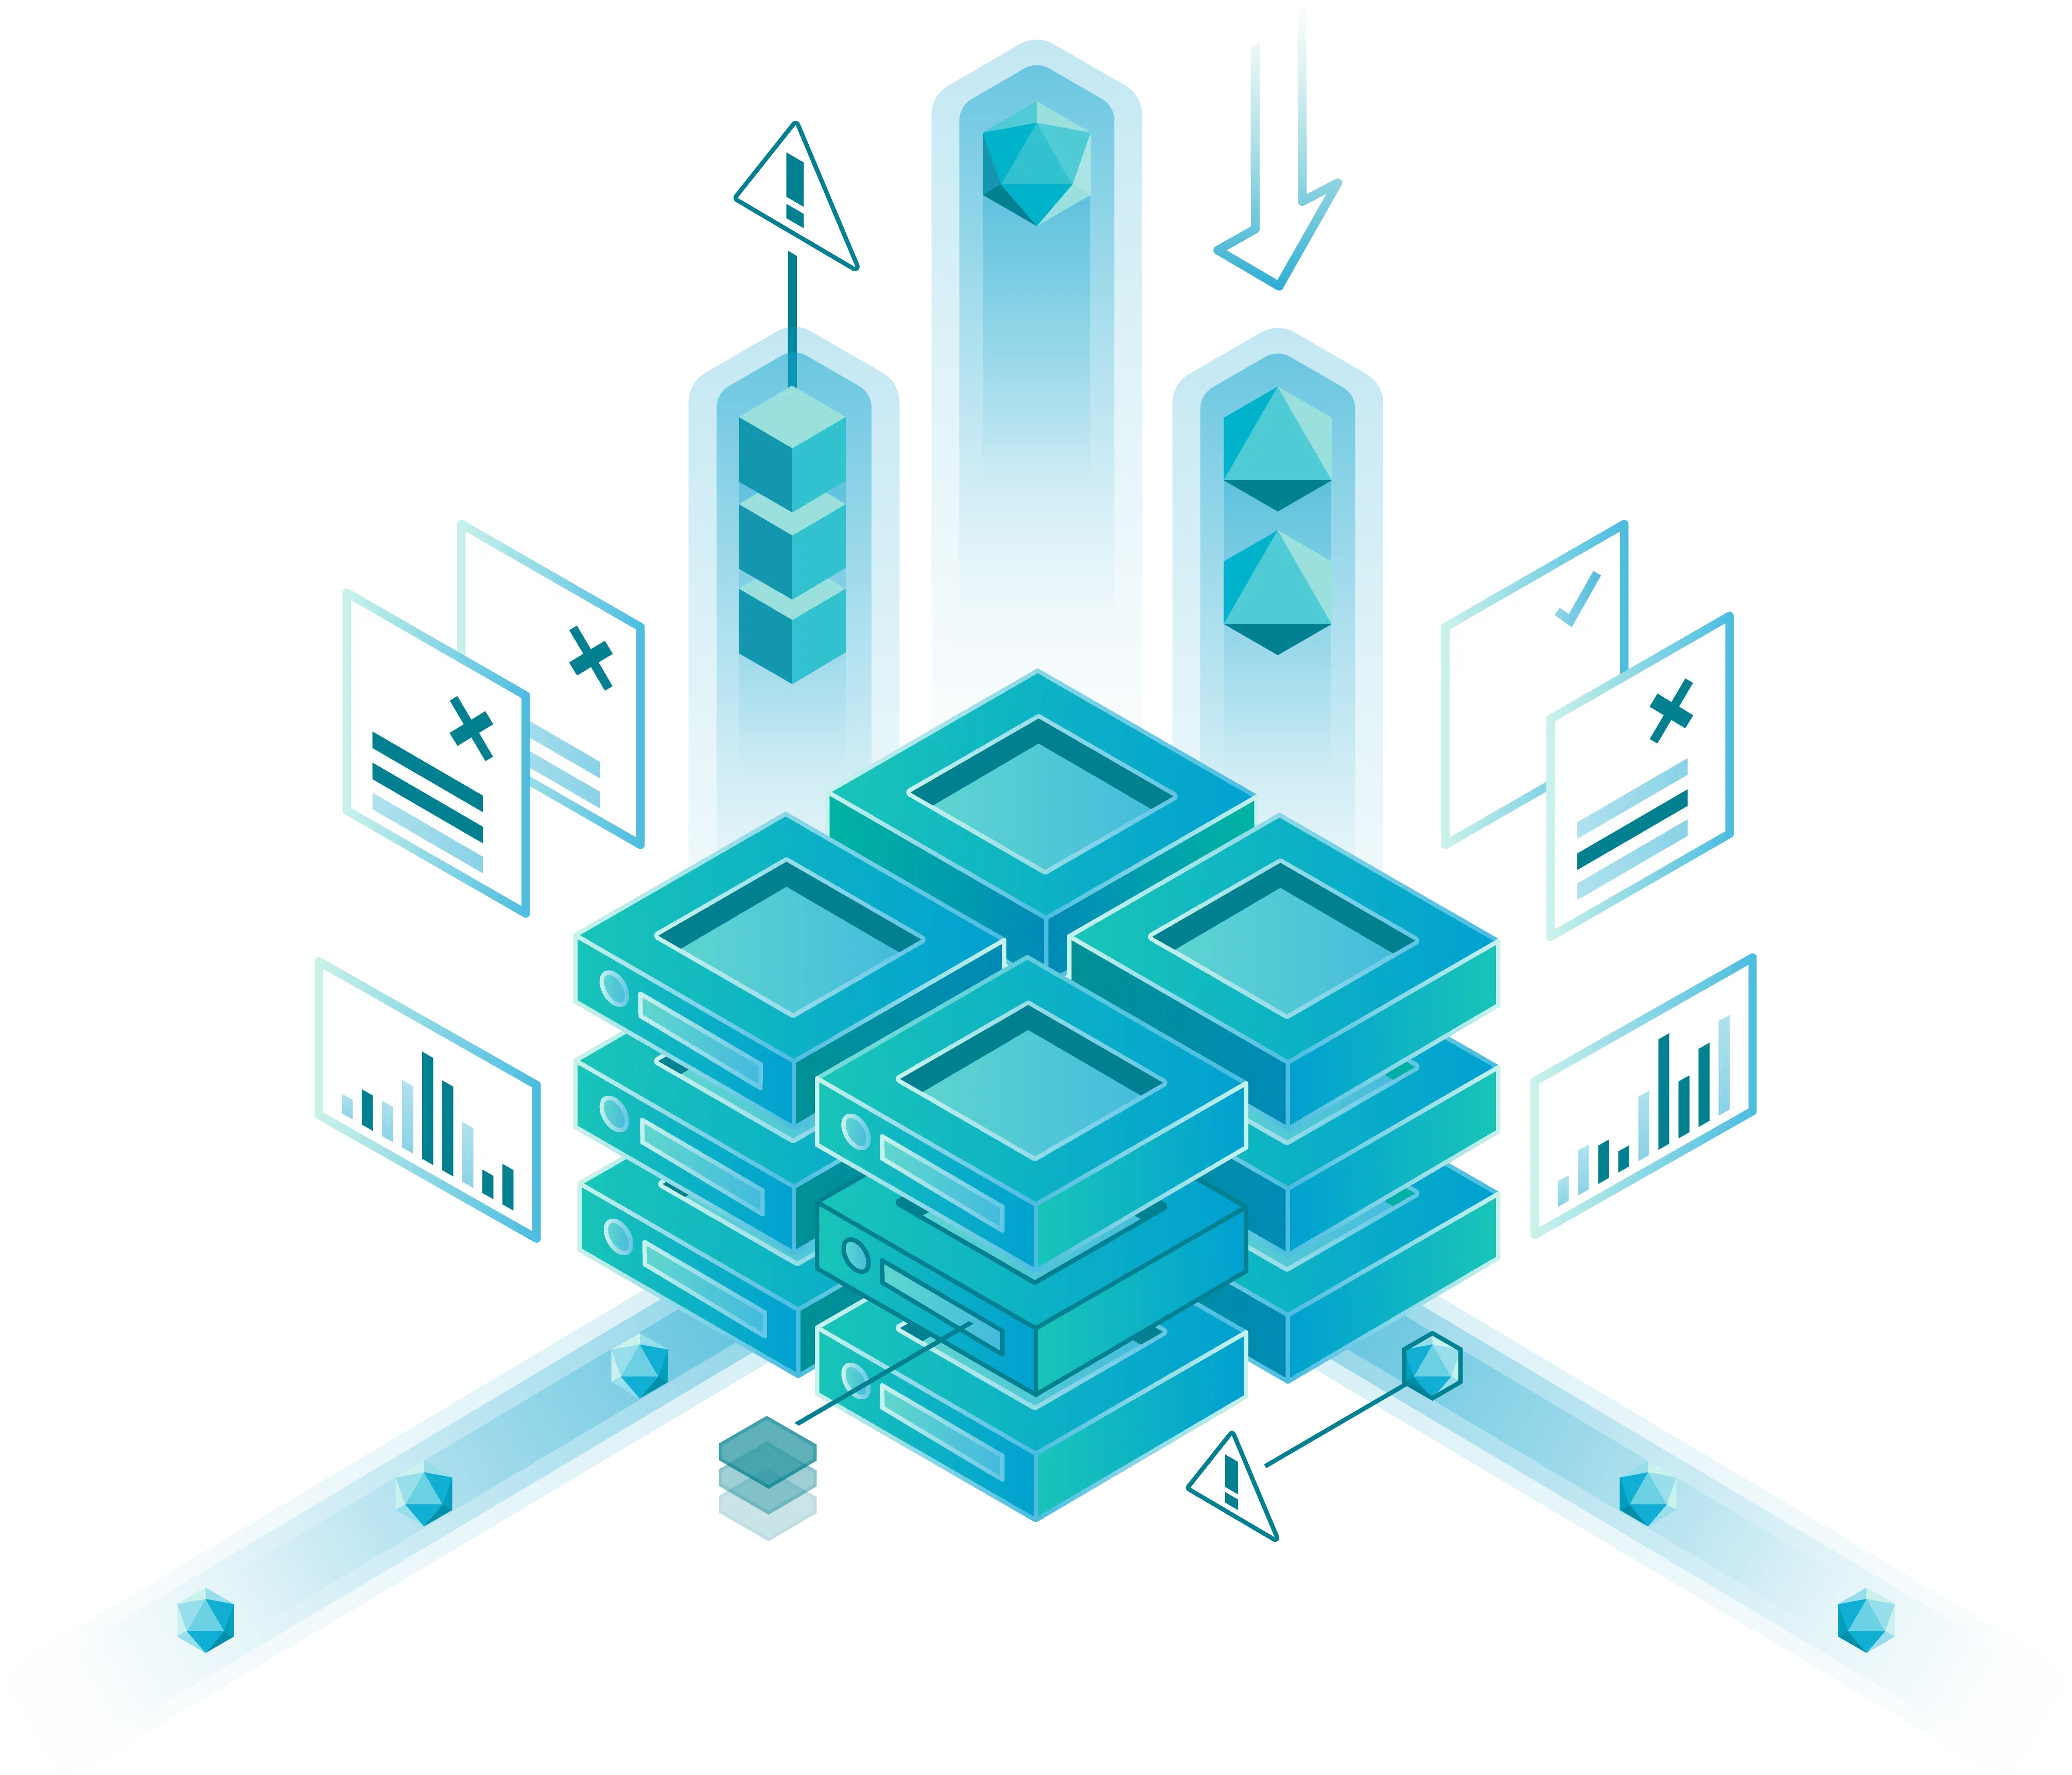
Key Develocity Solution Capabilities for CI & Platform Engineers
Develocity has a robust set of capabilities that make your CI system run as efficiently as possible while making troubleshooting build issues as easy as possible.
CI Build Cache. CI Build Cache enables you to optimize the speed of CI builds given compute resource and cost constraints by reusing unchanged build and test artifacts. This not only speeds up CI builds but also saves a substantial amount of compute resources. Develocity Build Cache supports both Gradle and Maven CI builds. For cloud-hosted services, this translates directly and proportionately into lower bills. For internal CI teams, this means growing demand can be handled with existing resources. You can learn more about Develocity Build Cache features here.

Predictive Test Selection. Predictive Test Selection can save up to 90% of testing time. It uses machine learning to evaluate thousands of builds to determine which tests are relevant to the code that changed. If tests aren’t relevant to your changes, you can safely skip them. (Run every test when you go to production, of course.)
Test Distribution. Test Distribution accelerates the test portion of your build and test cycle by distributing your test cases across agent pools. Tests are distributed based on your build history so that workloads are spread as evenly as possible. Finally, all results from all test cases on all agent pools are shared in a single Build Scan.

Performance Continuity. Performance Continuity helps keep your builds fast by giving you insights into what is driving the performance trends behind your builds. If build times are starting to slip, you can more easily identify the trouble spots. You can also better optimize complex build and test configurations to avoid inefficient test and build executions. For example, over time more and more build actions that could be cached may be executed unnecessarily. Resource profiling capabilities available in Build Scan help you identify build actions that put a lot of load on your CI infrastructure. You can use this intelligence to focus your load-reducing efforts on the most impactful build actions.
Build Scan. Build Scan gives developers detailed data for every build so they can quickly find the root cause of build and test failures and fix them on their own, without requiring CI to re-run broken builds unnecessarily. For example, Build Scan helps CI determine quickly if a build and test failure is the result of a verification error (i.e., a problem with the code that developers need to fix) or infrastructure that they need to handle. Knowing where to start and who owns the problem resolution saves a lot of time and potential frustration.
Failure Analytics. Failure Analytics improves build, test, and toolchain reliability by making problems like flaky tests and other avoidable failures easier to find, reproduce, and prioritize for fixing (based on an impact assessment and frequency of occurrence). Empowering devs to quickly find and fix flaky tests locally creates less downstream impact on CI. That is, every build failure on CI that could have been addressed locally means that at least one more build retry, consuming resources on CI.

Management Reporting & Trends. Management Reporting & Trends helps you react to tactical performance bottlenecks and daily failures. It also helps you respond proactively to systemic problems and longer-term performance regressions. This is accomplished via dashboards that make key metrics and KPIs more observable and actionable.
CI Test Failure Dashboard
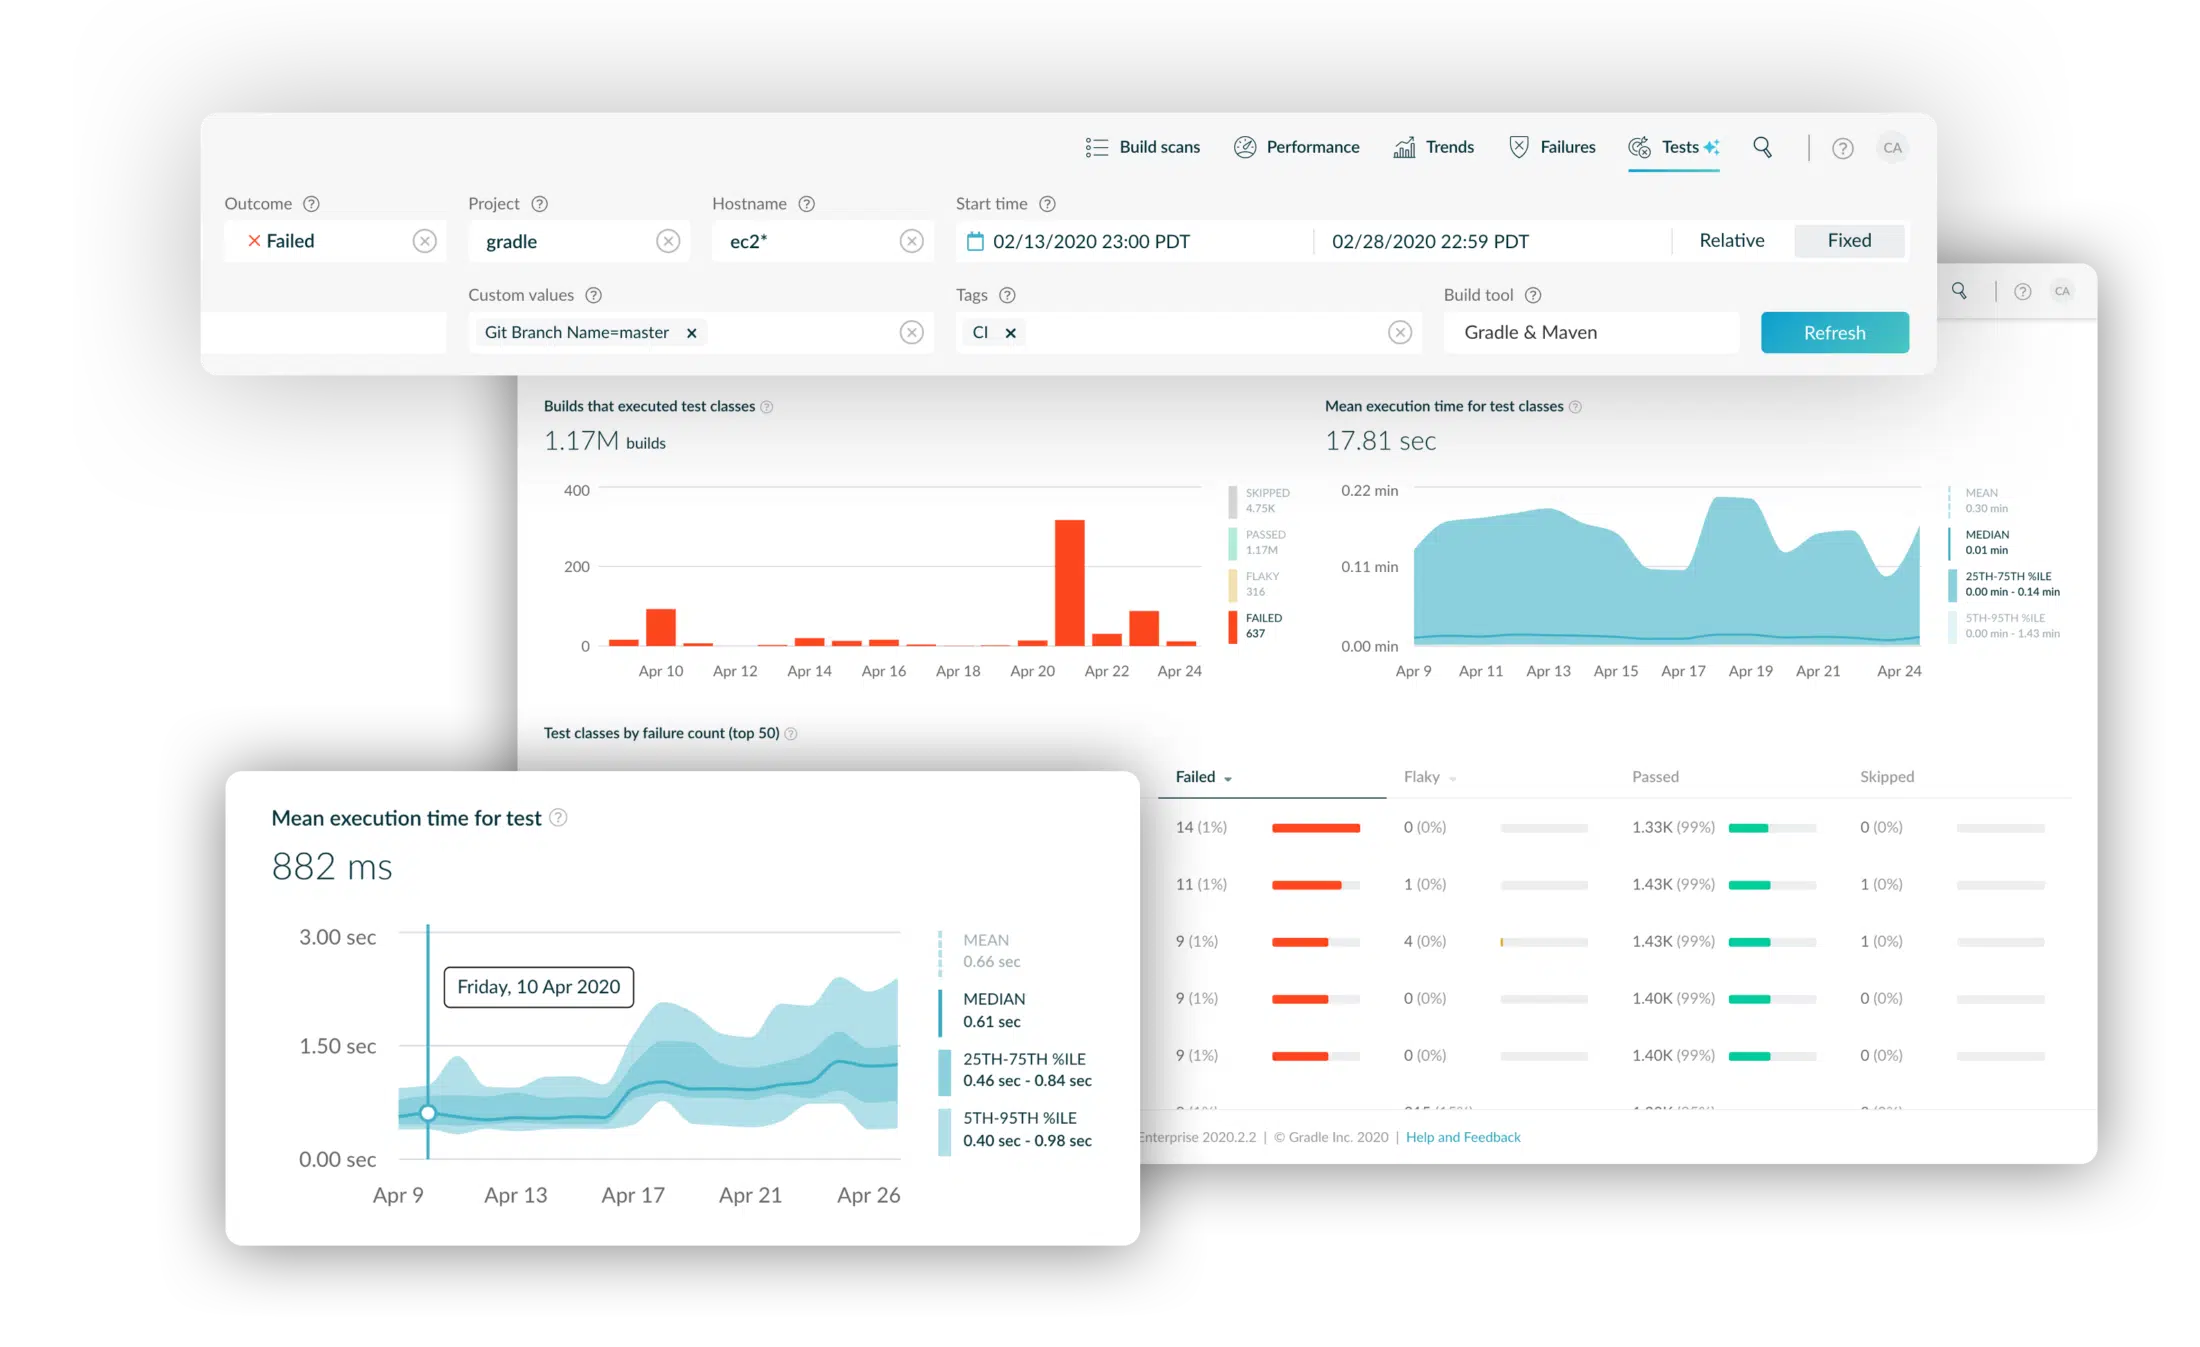
Slice and dice your build performance and test data using dynamic filtering.
CI Build Failure Dashboard
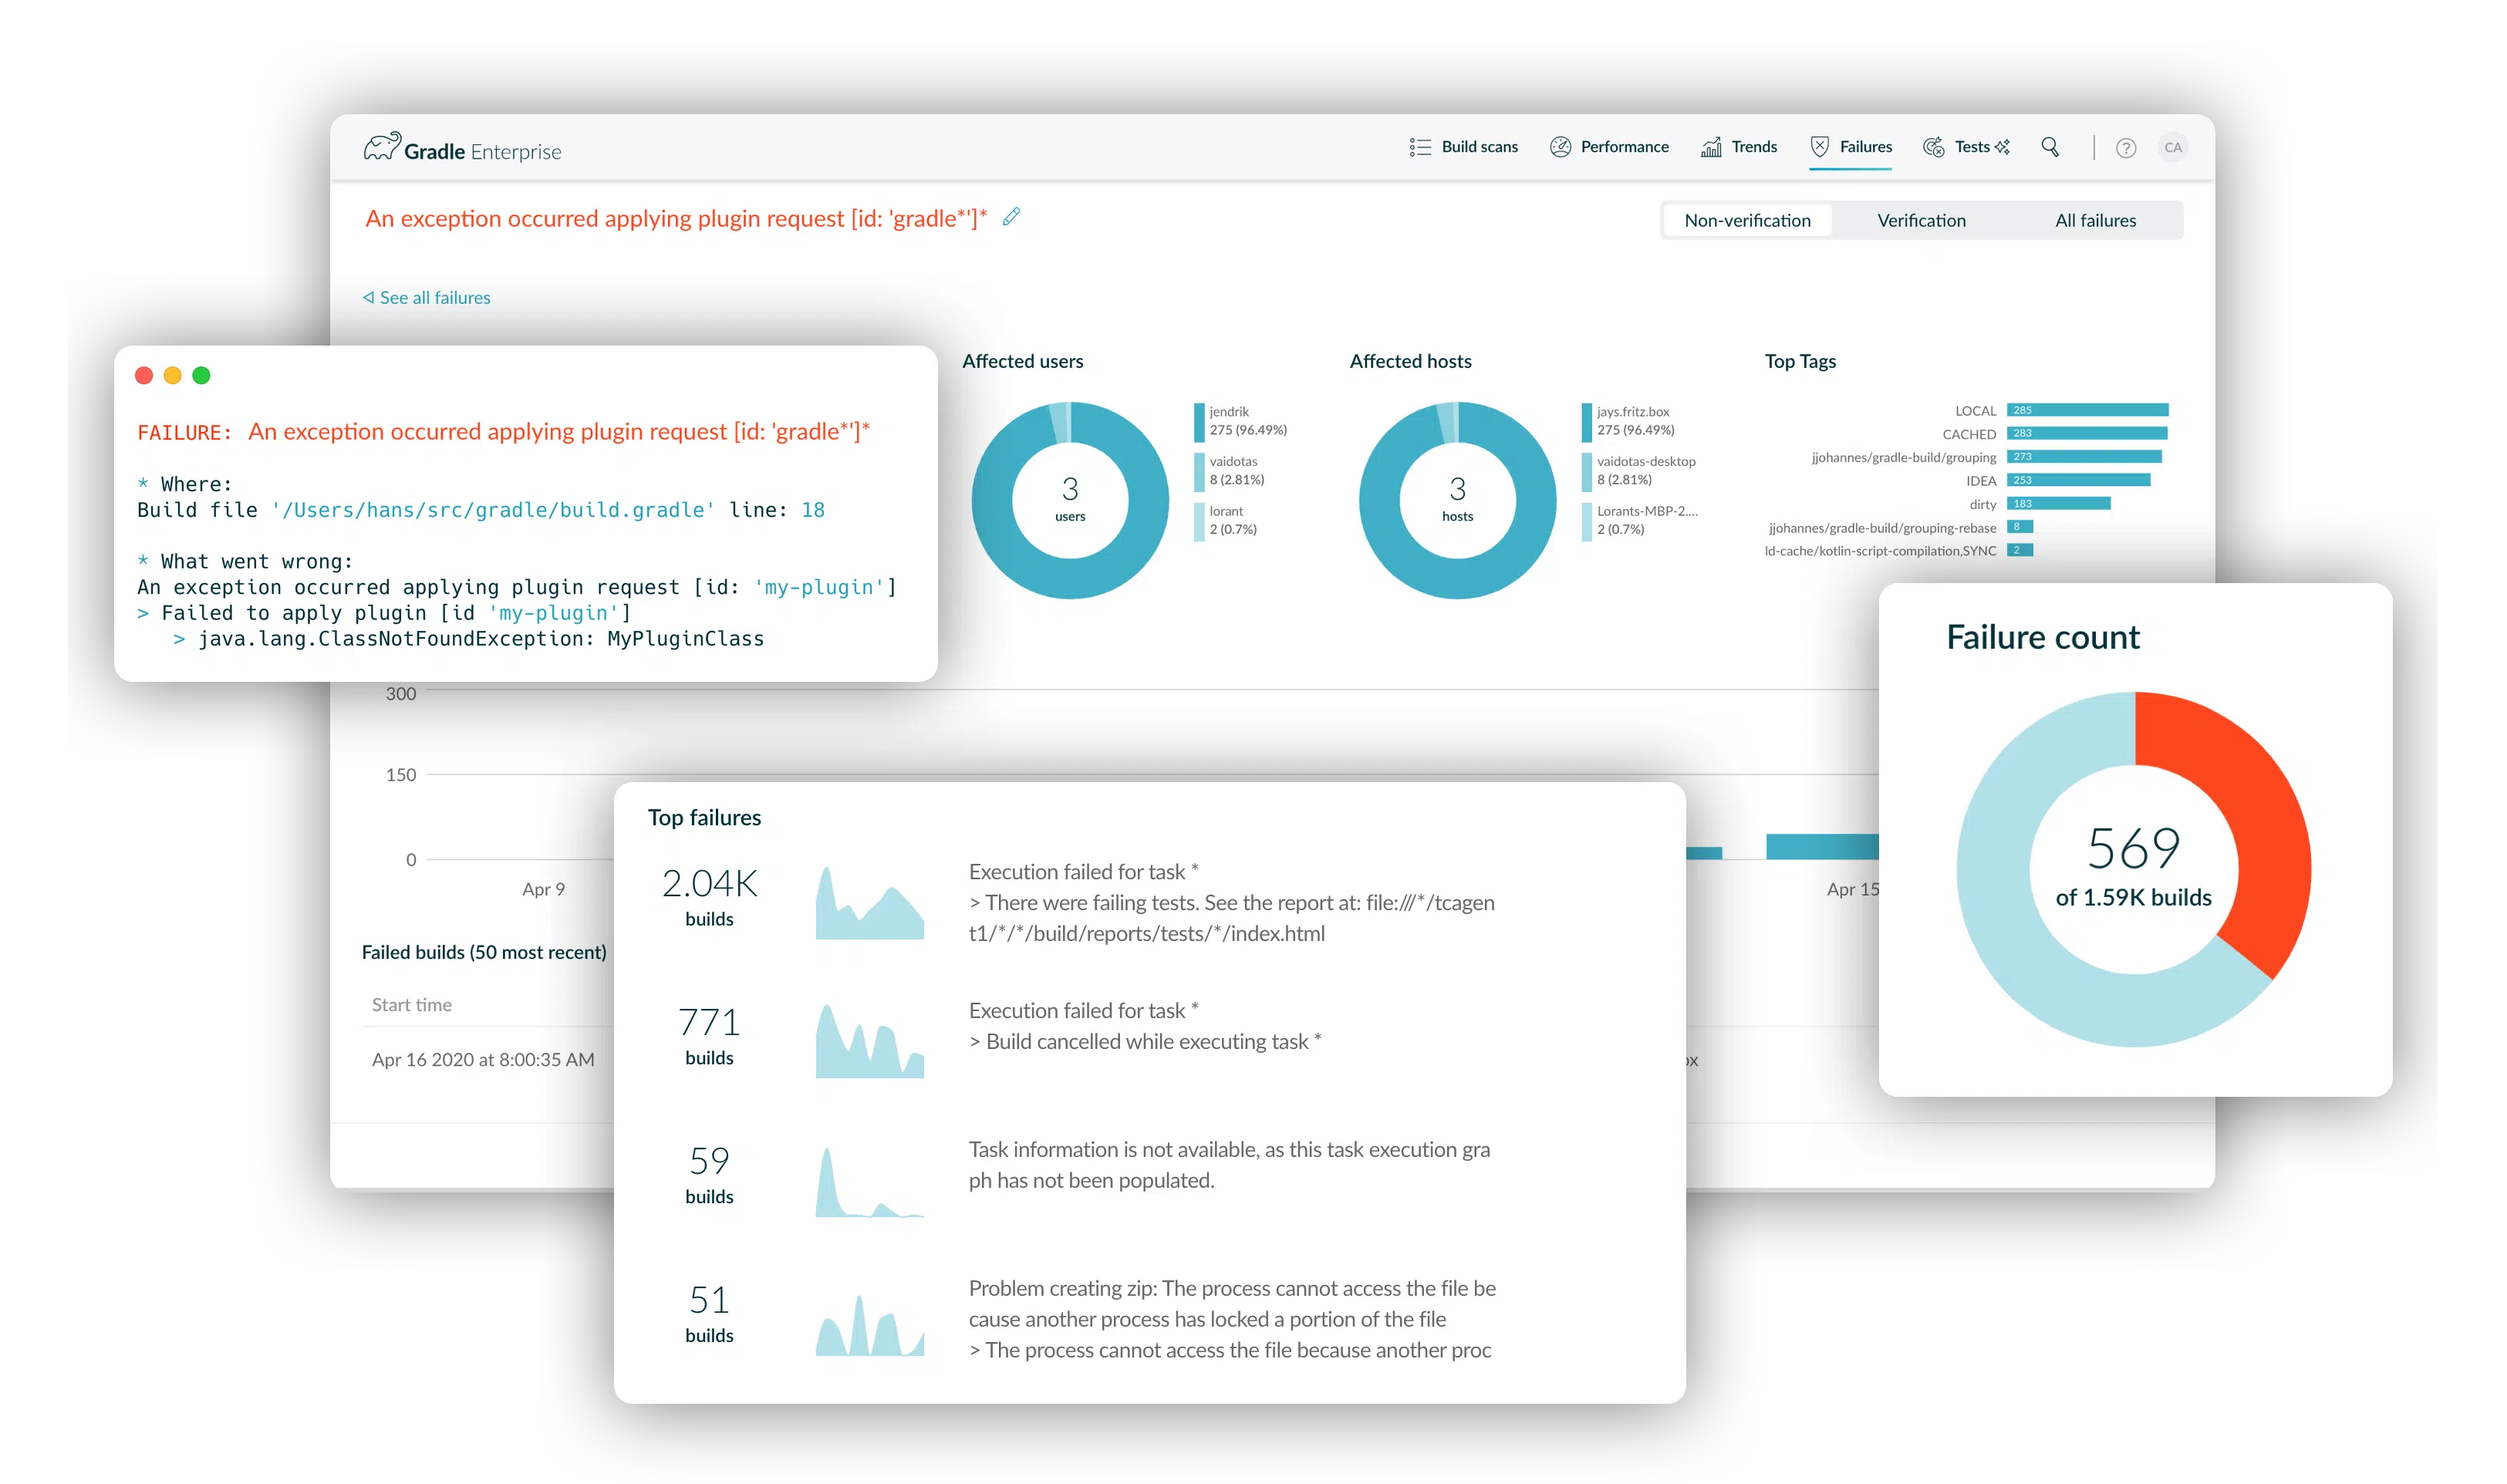
“Am I the only one seeing this failure?” Search Maven and Gradle build failures like StackOverflow or identify common yet disruptive build failures using Develocity’s advanced failure analysis features.
Learn More