


Testing takes the overwhelming majority of time during software builds. A single test can waste countless hours of building time — a single failure may cause an entire CI pipeline to have to be re-run. Ugh.
In this post, I will show you how to identify slow and unstable tests using the new Tests Dashboard in Develocity 2019.4 for Gradle and Maven builds. The dashboard visualizes test results across many builds for tests executed by Gradle’s built-in Test task and Maven’s SureFire plugin.
The Tests Dashboard is available in 2019.4 as a partial preview of a larger set of testing-oriented functionality that will be available as an add-on package in upcoming Develocity versions. Depending on your usage license, this new functionality may not be available to your installation when it is no longer in feature preview. If you have questions regarding this matter, please contact Develocity support.
The top tests report shows the test classes that fail most frequently given the build search query. Selecting a test shows the stability and performance trends over time and a list of the least stable test methods and recent executions.
Identifying the least stable tests
To demonstrate the new tests dashboard, I’m going to give an example involving the recent Gradle 6.0 release, where we want to find unstable tests that may point to regressions in Gradle’s user-facing behavior.
The Gradle CI pipeline contains hundreds of build configurations that collectively run 573,644 tests. There is structure to this pipeline, but it is cumbersome to focus directly on the tests themselves.
In order to figure out which tests need attention before the 6.0 release, I’m going to search for builds with a Git Branch Name=release custom value on CI. I’m also going to isolate my analysis to the ReadyForRelease phase (tag) of the CI pipeline, which runs integration tests that emulate users’ builds.
After filtering builds, I click the Tests Dashboard button ![]() to see the test classes that failed the most often the week before the release.
to see the test classes that failed the most often the week before the release.
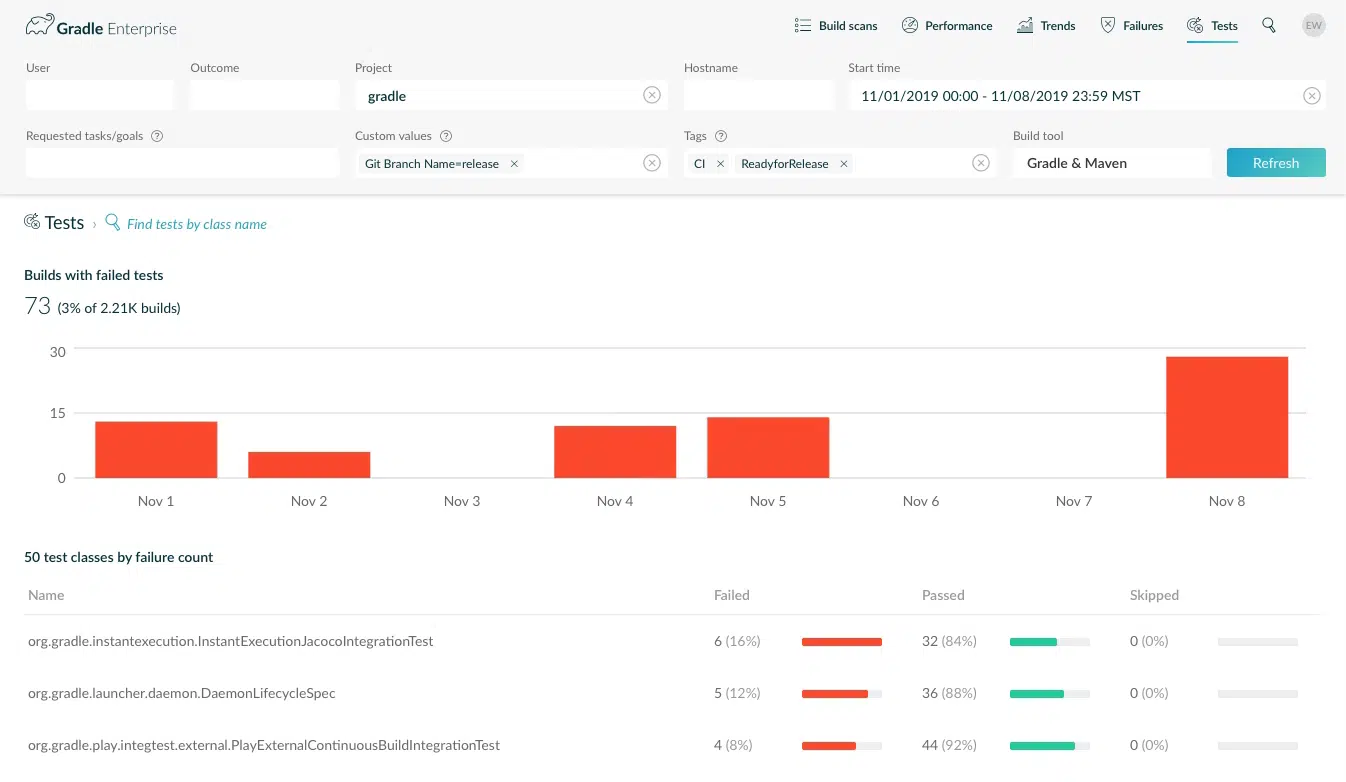
The top tests view shows the count and ratio of matching builds with test failures each day, and a list of the tests that have failed the most frequently. Each listed test is accompanied by counts and visualizations that:
- convey the stability of the test (the 1st test failed on 16% of executions)
- visually compare it to other tests (the 1st test’s failure count is only slightly higher than the 2nd)
For purposes of the Gradle 6.0 release, I know that someone is working on InstantExecutionJacocoIntegrationTest, so I click on DaemonLifecycleSpec to investigate because it failed on 5 of 36 recent executions.
Test stability and performance trends
Choosing or searching for a test class shows the test container view, with outcome and performance trend charts for all matching tests, and a list of the least stable test methods.
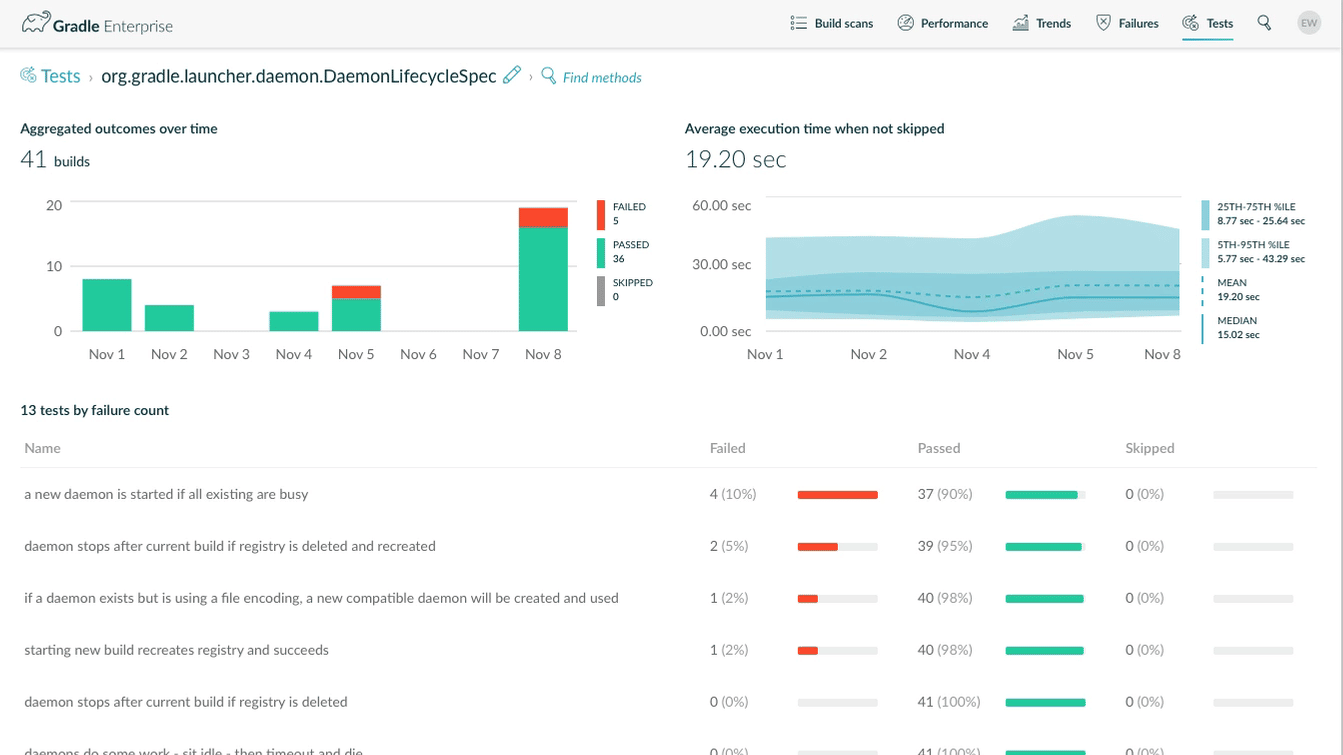
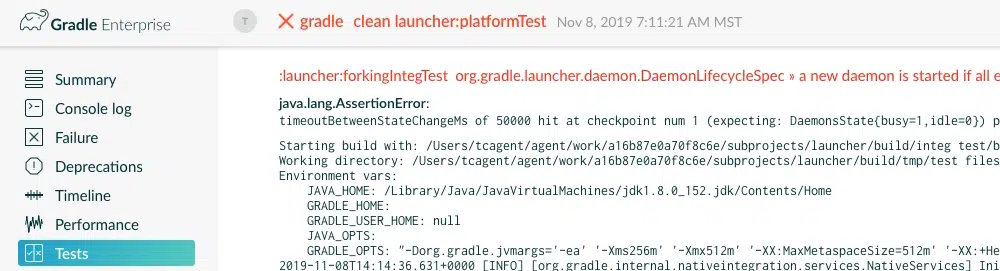
I see that there were 8 individual test failures in 5 failing builds. The worst offender is DaemonLifecycleSpec.a new daemon is started if all existing are busy(). I dig deeper to see if there is a pattern to the failures. Clicking a single test method in the list returns reliability and performance trends for the test, along with a list of recent builds.
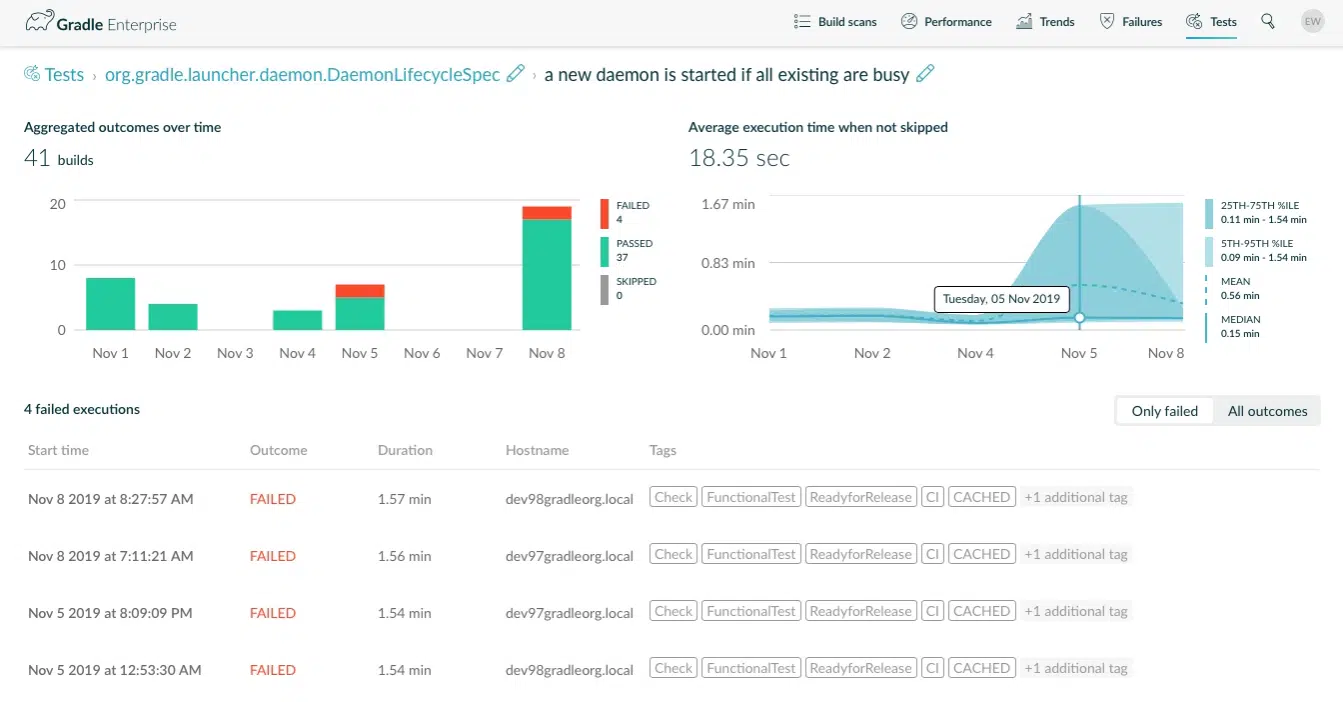
By default, this view shows recent test executions that failed so I can immediately start looking for patterns of failure.
One thing stands out immediately: almost all of these failed executions took just over a minute and a half. The execution time trend chart shows a clear increase in test execution time recently. I observe that failures occurred on only 2 CI agents, so I extend the time range to the previous 4 weeks. Again, I see failures on just a couple of CI agents.
I click “all outcomes” just to confirm a pattern I think I’m seeing.
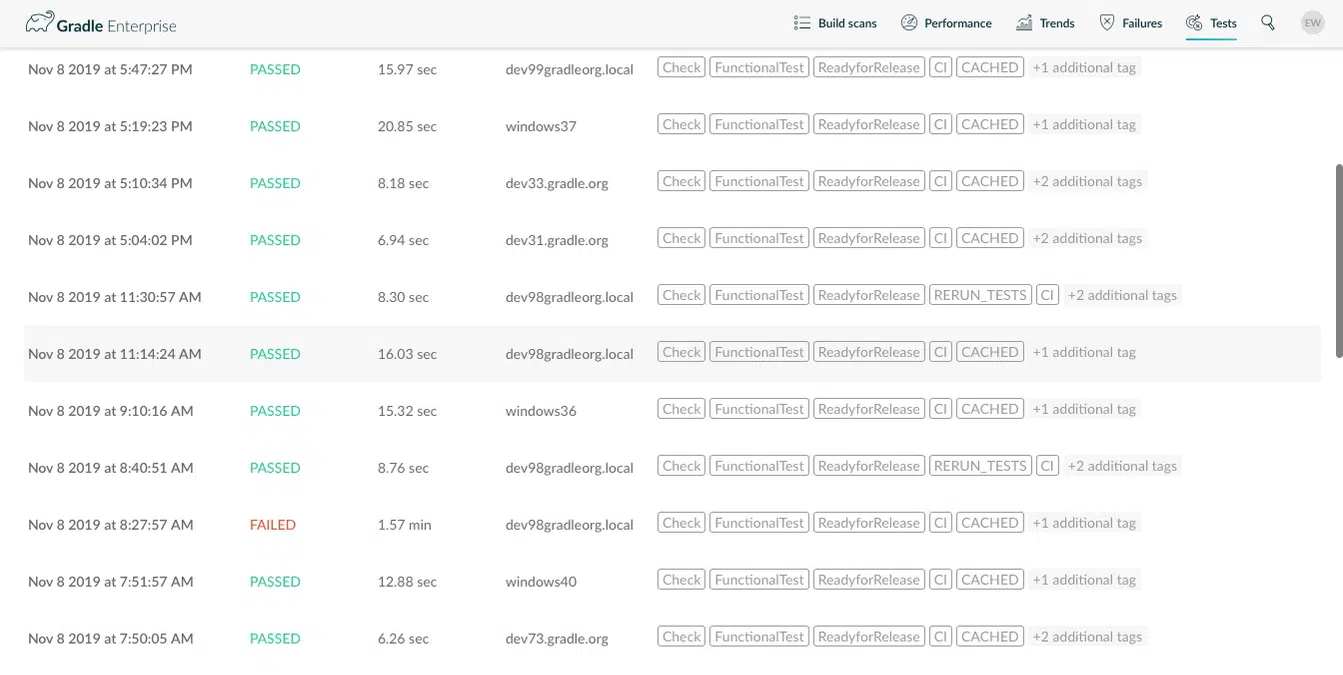
From this I learn that the test passed when immediately re-run on the same agent. Not only that, but dev97gradleorg.local and dev98gradleorg.local are macOS CI agents — this test is flaky, but only on macOS!
Clicking on any test execution in the list navigates to the test execution in the build scan. Here I can look at the test outputs to confirm the problem.
This identifies a real problem with the Gradle Daemon not properly releasing locks on the daemon registry on macOS. It helps our prioritization to know that it affects ~15% of builds on macOS. This is information that would be very difficult or time-consuming to know otherwise.
Analyzing groups of tests
The tests dashboard also provides stability and performance analysis of a logical group of test classes matching a glob pattern, where * matches zero or more of any character. This can be used to analyze a package (e.g. com.example.app.activities.*), or analyze all tests of a certain type (e.g. *PerformanceTest), or a specific class. In particular, package based searches can be used to analyze testing of a certain software component which may be the focus of optimization.
Here I search for tests in the same package as DaemonLifecycleSpec shown earlier in this post: org.gradle.launcher.daemon.*
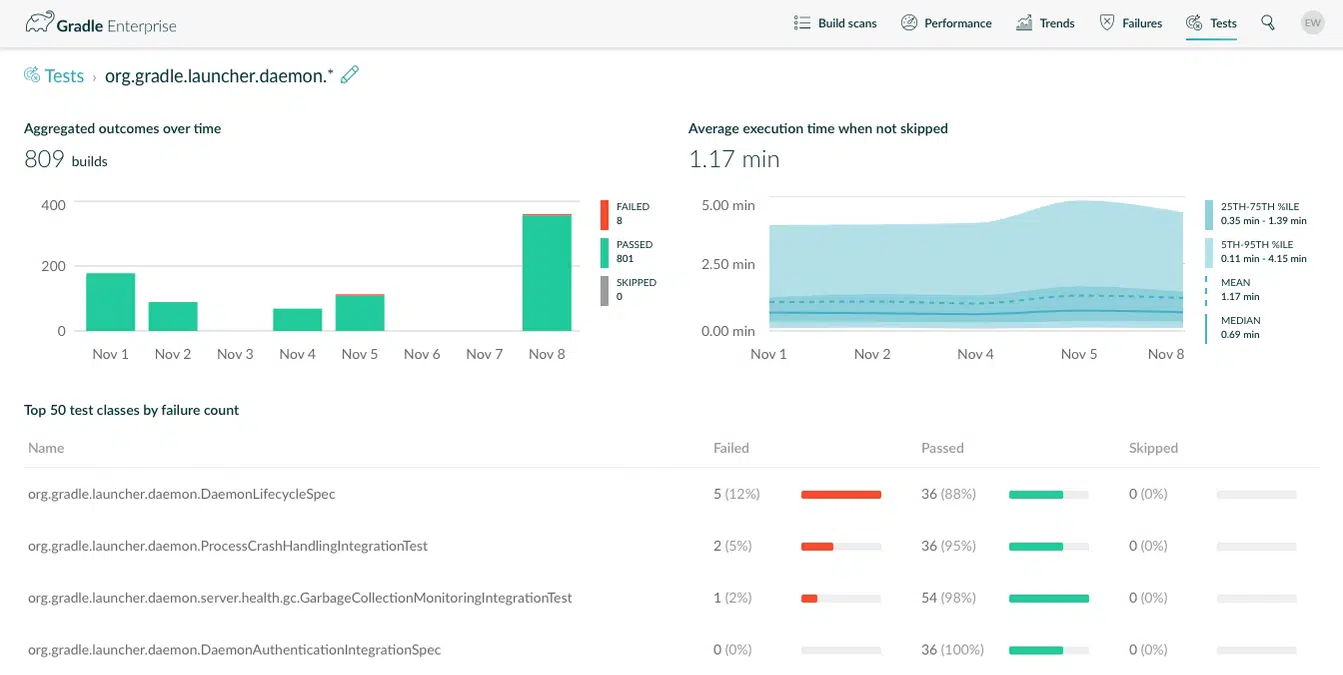
This finds 2 other tests to look into, as it turns out that the ProcessCrashHandlingIntegrationTest is also affected by the Daemon locking problem. This is very helpful information to engineers to investigate the root cause.
You can use aggregate test analysis to begin answering questions like:
- Are our browser/device tests failing more in general?
- How did adopting coroutines in production code change the performance of this test?
- Which generated test parameters cause the most failures?
- Has this particular test gotten slower or faster over time?
I imagine you can think of other insightful uses for your organization.
Go forth and test
We hope that the new tests dashboard in Develocity 2019.4 makes test analysis, investigation, and fix prioritization easier for your Gradle and Maven builds.
If you’re interested but not already using Develocity, you can try it for free by requesting a trial.
Stay tuned for more blog posts about new analytics features coming in each Develocity release.